
Product
Learn
Customers
Pricing
Login
Try Arrows
You'll also be subscribed to the Happy Customers newsletter.

Not sure where to start? Download the 7 playbooks you need to scale across the customer journey.
You'll also be subscribed to our newsletter, which includes new posts added to The Vault.
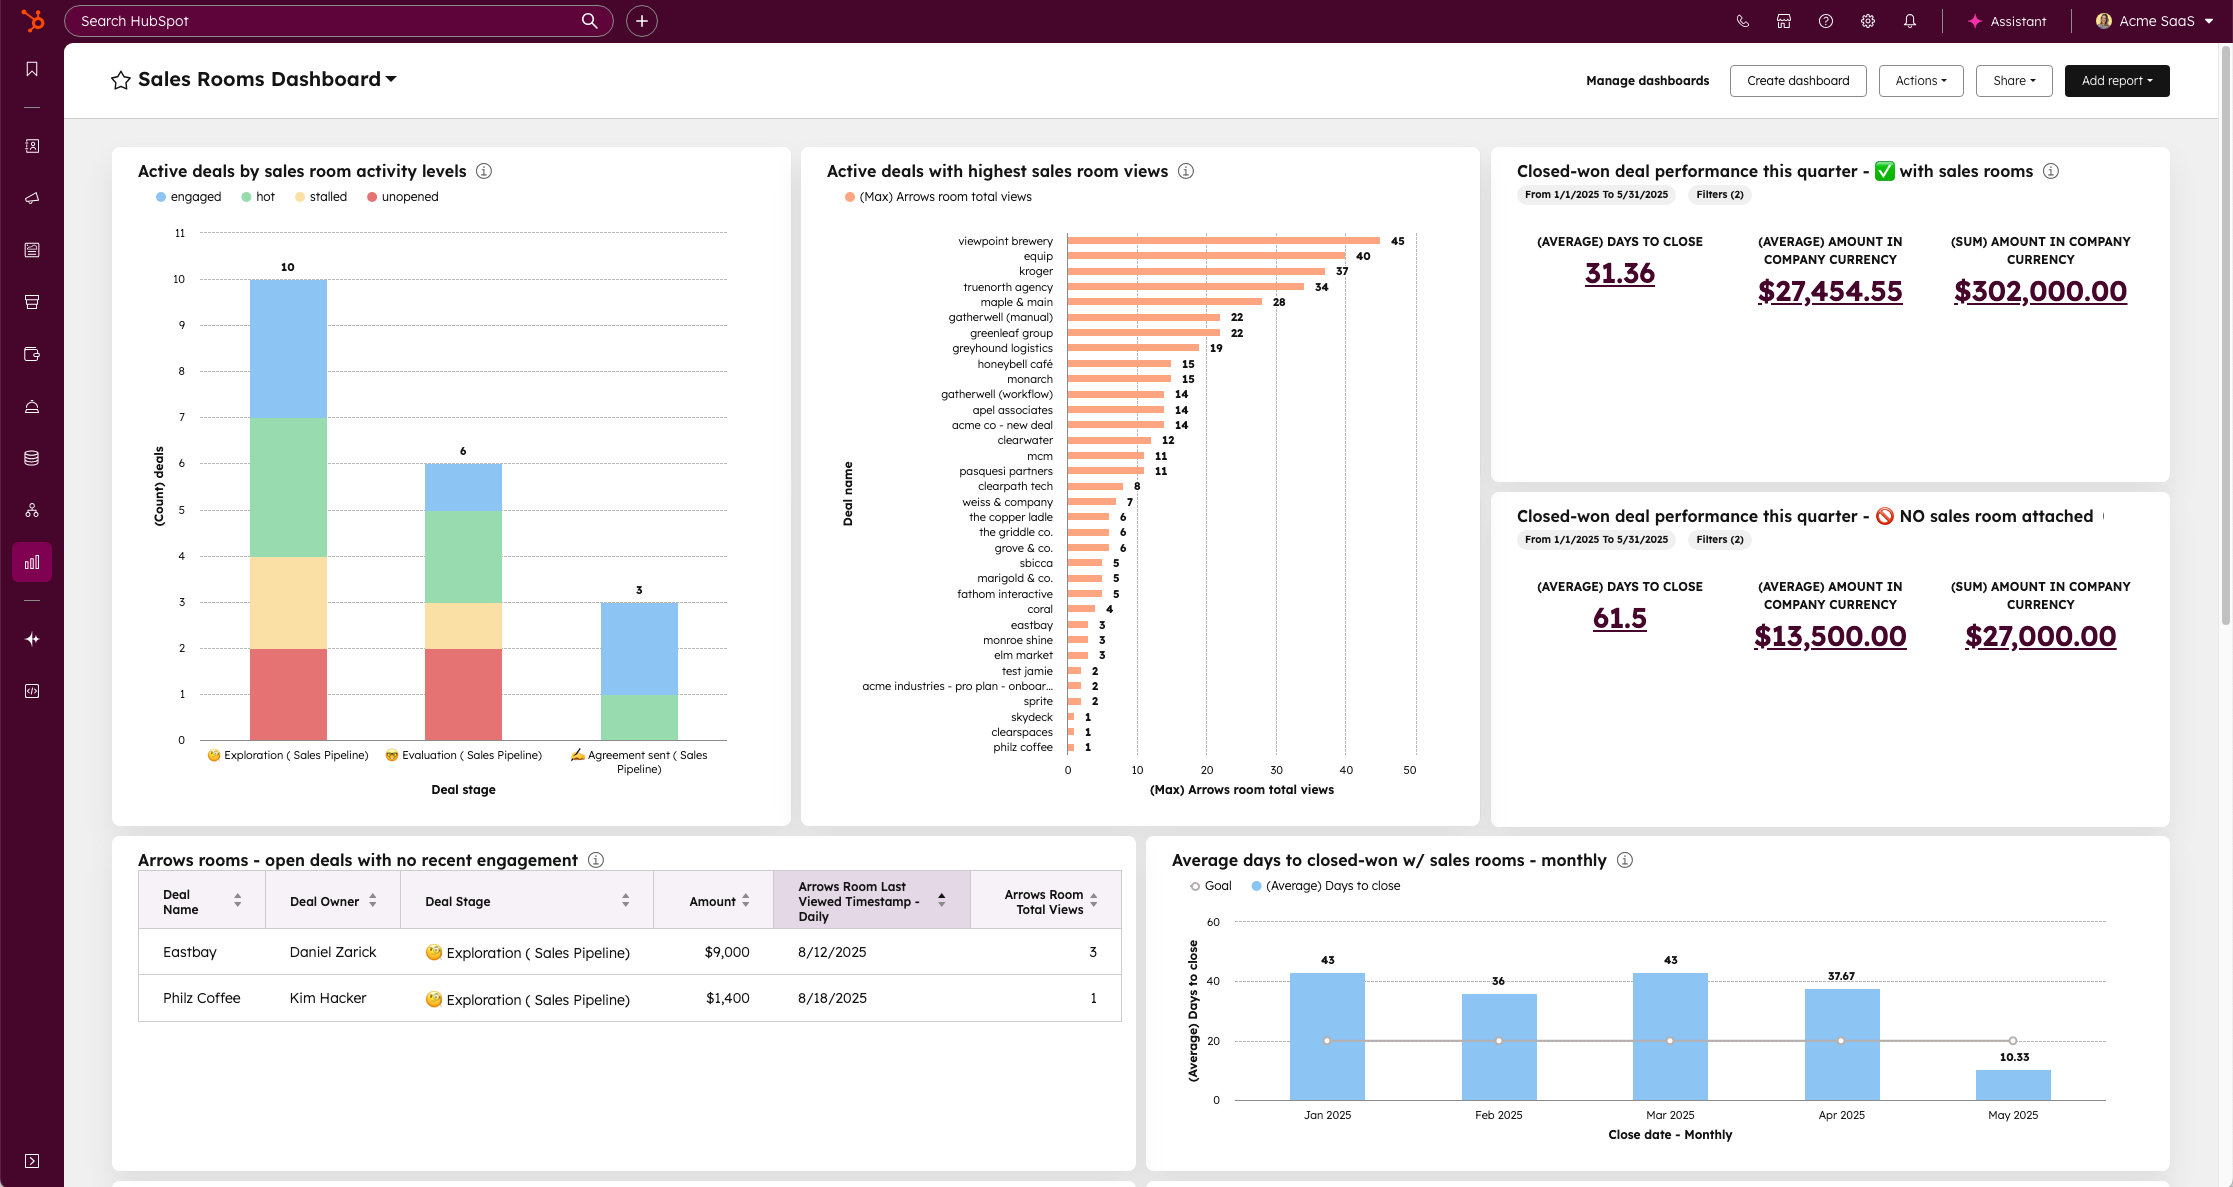
If your team is using Arrows sales rooms to manage deals in HubSpot, you already know the value of giving buyers one clear place to collaborate, review content, and make decisions. But to understand how sales rooms are performing — how they impact deal velocity, win rates, and rep behavior — you need to bring that engagement data into HubSpot.
These nine reports help you do just that. Each one gives you a different view into sales room effectiveness: from how active your buyers are, to which reps are driving the most engagement, to whether multi-stakeholder deals actually close faster.
Every report uses Arrows sales room data synced into HubSpot and includes step-by-step instructions so you can recreate them directly in your own portal.
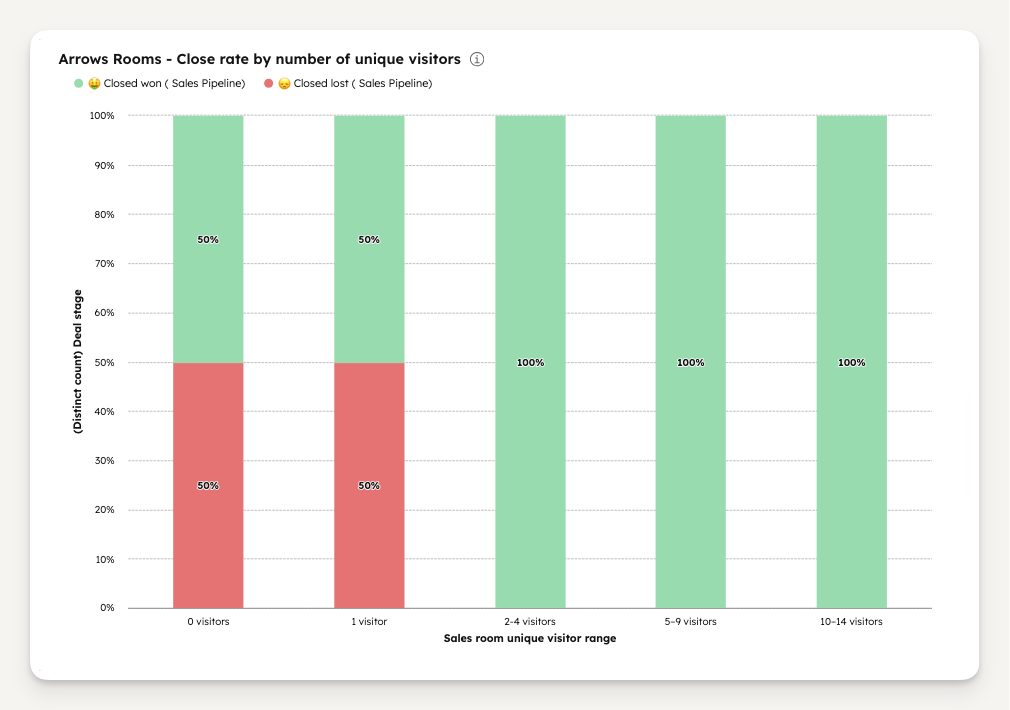
This report measures how the number of unique people engaging with your sales room correlates with close rates. It buckets deals by visitor ranges so you can see whether deals with more stakeholders involved tend to perform better.
It’s a powerful way to visualize the value of multi-threading in your sales process. If you notice that deals with five or more visitors close significantly faster or at a higher rate, you have real data to back up what great reps already know — multiple champions drive momentum.
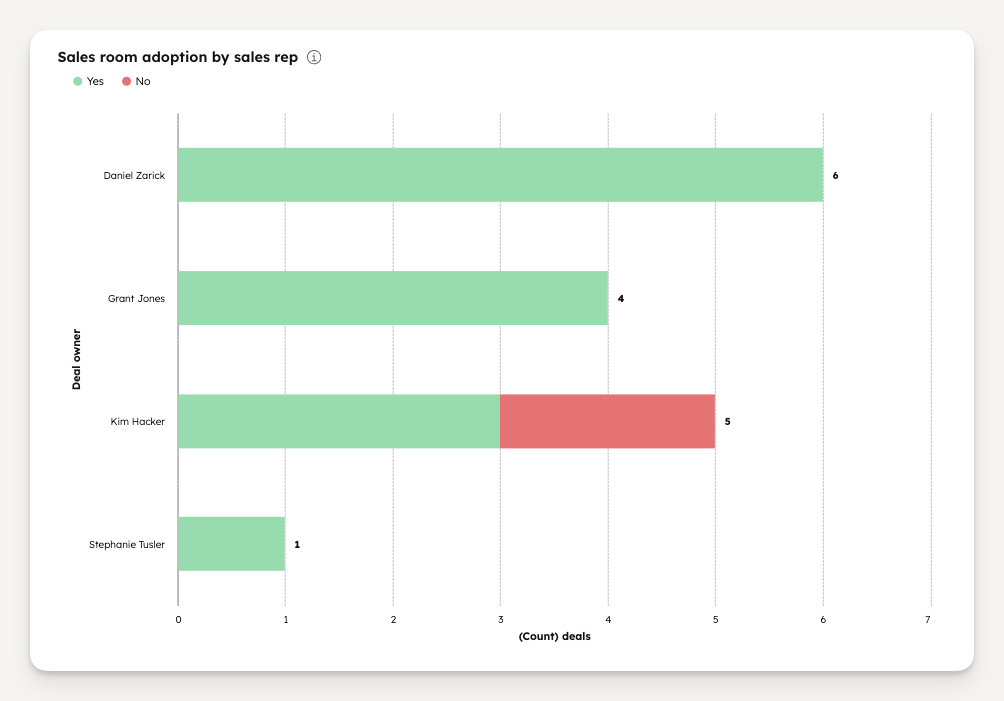
This report helps you measure how consistently your sales reps are using Arrows sales rooms. It combines a workflow and a simple yes/no property in HubSpot to automatically mark whether each deal has a sales room attached.
The result is a clear, color-coded breakdown of sales room adoption by rep. You’ll see exactly who’s using them consistently, who might need coaching, and how close your team is to full adoption. Over time, you can use this to track improvements as you reinforce sales room usage as part of your sales process.
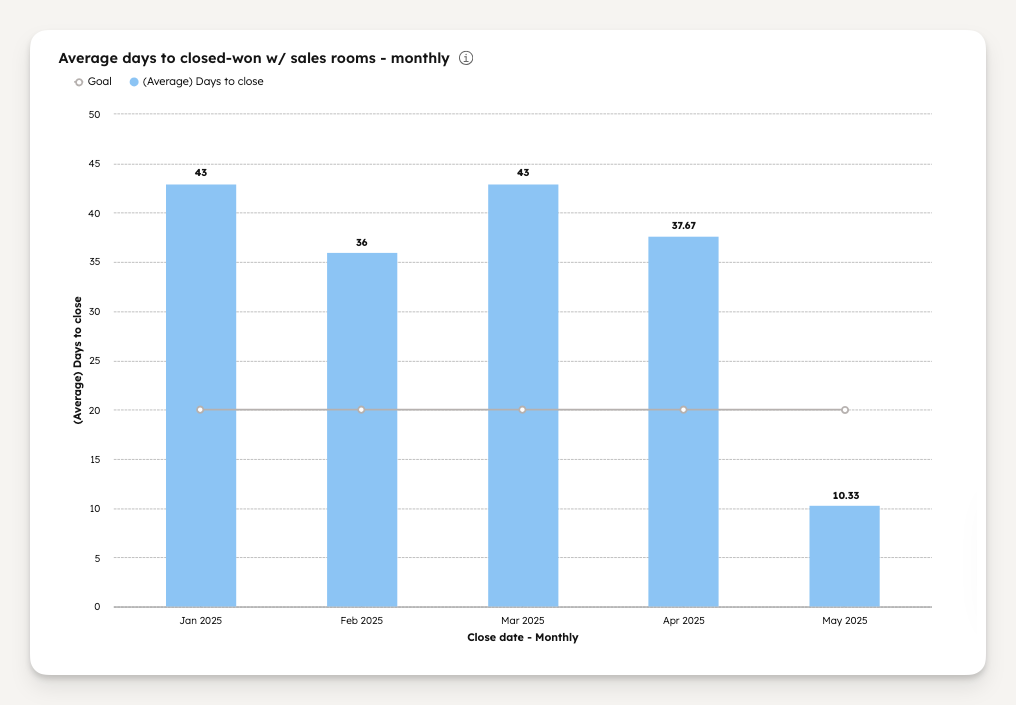
This report tracks the average number of days it takes to close a deal when a sales room is attached — visualized month over month. It helps you understand whether your changes to sales room content or templates are actually improving deal speed.
You’ll often see that when reps use sales rooms consistently, their deals move faster. Buyers have fewer blockers because they can find everything they need in one place — pricing, contracts, next steps — and your champions are better equipped to drive internal approvals. This report gives you a simple way to monitor those improvements over time.
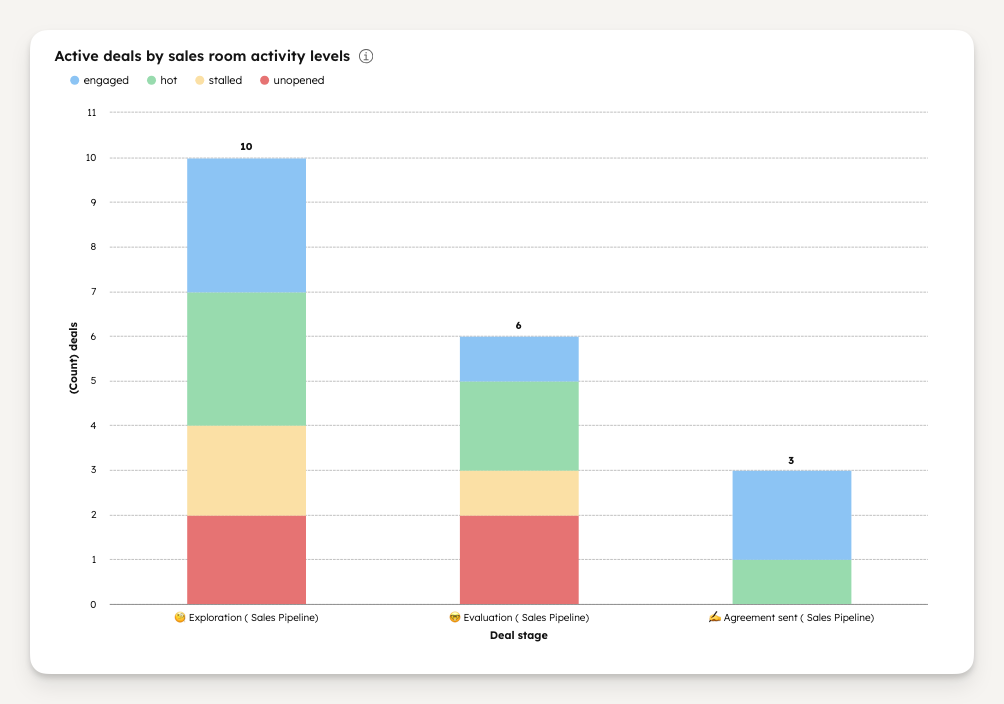
This report visualizes all your active deals by engagement level — hot, engaged, stalled, or unopened. These statuses come directly from your Arrows sales room data, based on how frequently buyers are viewing and interacting with their room.
At a glance, you can see where your pipeline is heating up and where it’s gone quiet. If you see deals sitting in “unopened” or “stalled,” it’s a sign your buyers may need a nudge or that the opportunity is cooling off. This report helps sales managers and reps prioritize outreach and spend time where momentum is strongest.
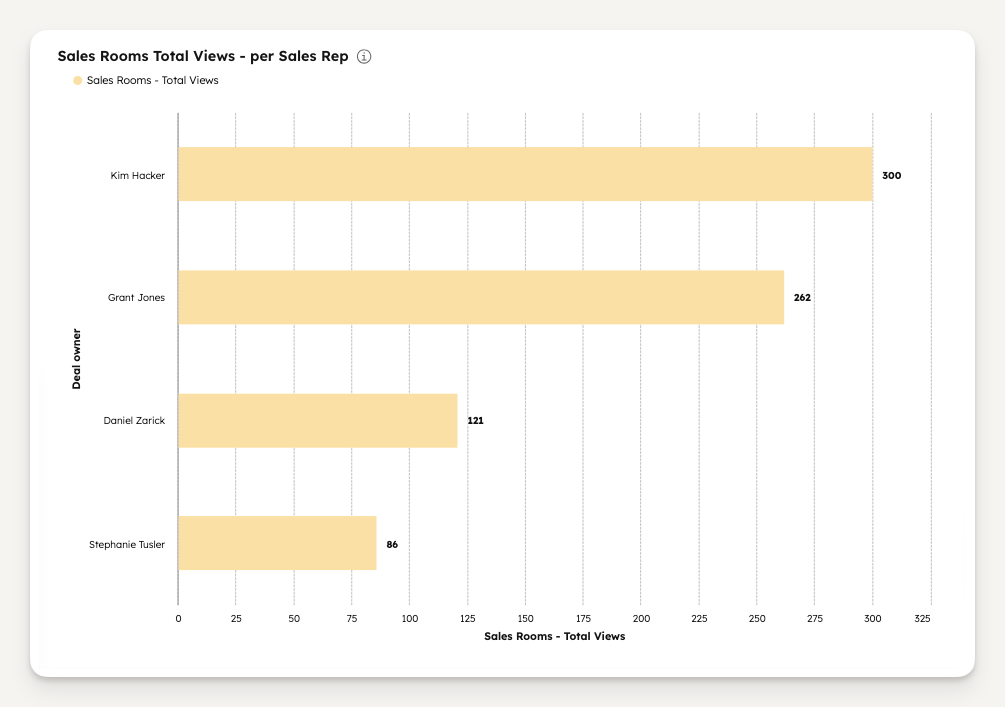
This report shows total sales room views grouped by sales rep, helping you identify who’s driving the most buyer engagement. High-performing reps might be introducing sales rooms earlier, adding more helpful content, or following up more proactively inside the room.
By surfacing these differences, you can learn from your top performers and coach the rest of your team on how to use sales rooms more effectively. It’s a great way to reinforce the connection between proactive selling behavior and stronger buyer engagement.
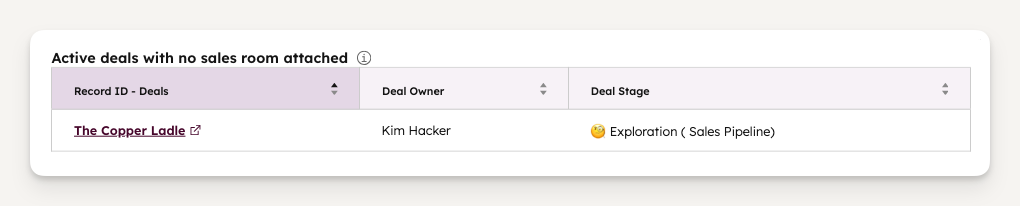
This simple but critical report helps you spot any active deals missing a sales room. If your goal is 100% adoption, this gives you a running list of deals that need one created or attached.
You can also use it to set up alerts or notifications when a deal enters a key stage without a sales room. That way, managers and reps can immediately correct it and make sure every buyer has the consistent, collaborative experience that sales rooms provide.
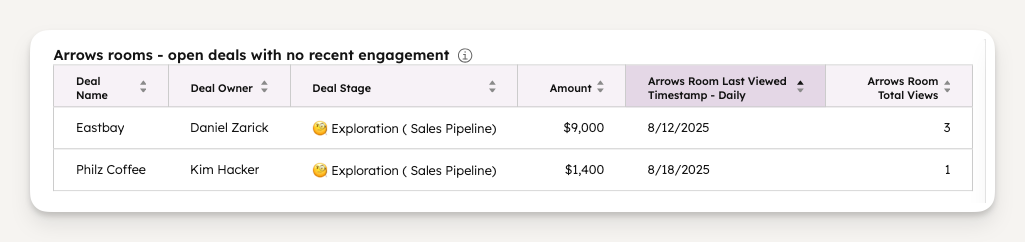
This report helps you find deals that have gone quiet — those where the sales room hasn’t been viewed in the last 14 days. It’s an easy way to see which buyers might have lost momentum or interest.
When you pair this report with your active pipeline, it becomes a powerful coaching tool. Sales managers can ask reps what’s happening with stalled deals, or help them re-engage those buyers before the opportunity goes cold.
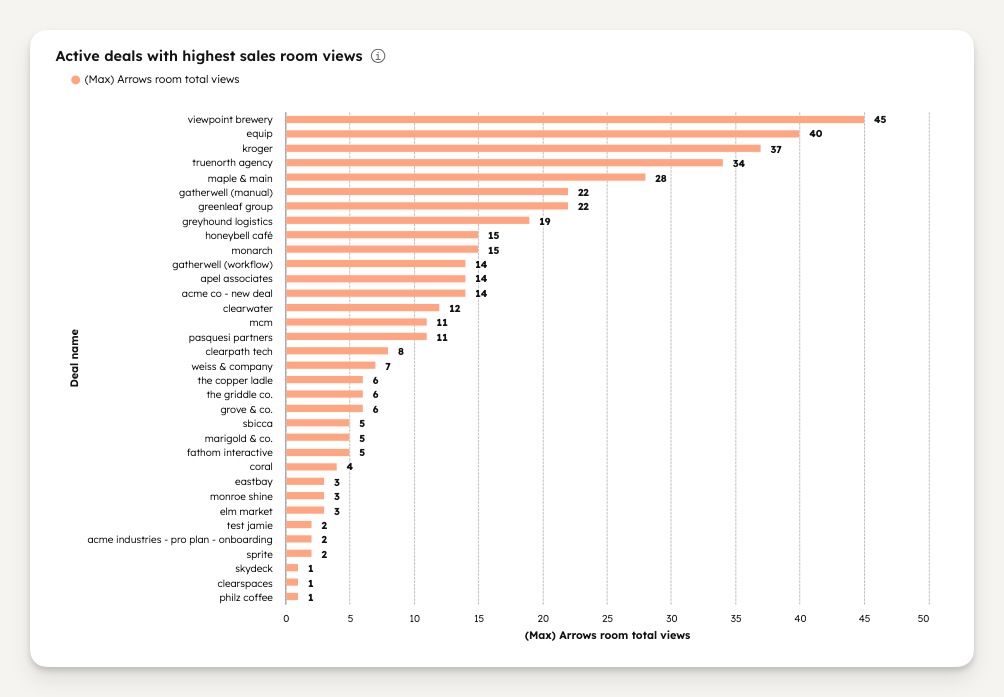
This report ranks all of your active deals by total room views. It’s a clear, visual way to see which opportunities are highly engaged — and which may be at risk.
When you look at this alongside your deal stages, it’s easy to spot trends. Maybe your mid-pipeline deals have high engagement but drop off later in the process, or maybe your early-stage buyers are unusually active. Either way, it helps reps focus on where activity (or inactivity) is happening in the pipeline.
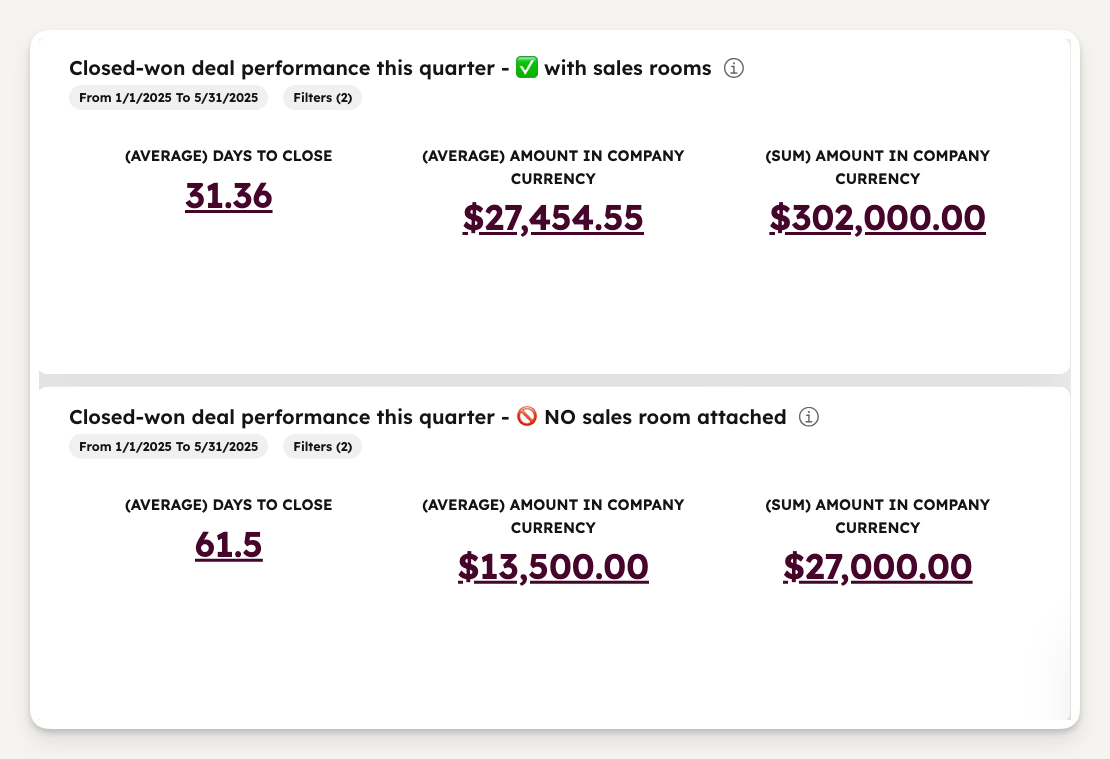
This KPI-style report helps you measure how deals using sales rooms perform compared to those that don’t. You’ll see metrics like average deal size, total amount closed, and average days to close — side by side.
It’s especially helpful if you’re gradually rolling out Arrows across your team. You’ll be able to quantify how sales rooms impact performance, prove ROI internally, and identify where broader adoption could have the biggest impact on your revenue outcomes.
When you bring these reports together into a single HubSpot dashboard, you’ll have a complete view of how Arrows sales rooms influence buyer engagement, deal velocity, and team adoption.
Together, they help you answer questions like:
💡 Want to build these yourself?
Follow the links above for step-by-step setup instructions and start tracking your sales room effectiveness directly in HubSpot.

Not sure where to start? Download the 7 playbooks you need to scale across the customer journey.
You'll also be subscribed to the Happy Customers newsletter.
Product demo
Schedule a demo to see Arrows sales rooms and onboarding plans live in your HubSpot workflow.


Average review on G2, an independent review site

App installs
On the HubSpot App Marketplace

