Track close rate by number of unique sales room visitors in HubSpot

One of the most powerful signals Arrows captures is how many different stakeholders are engaging with your sales room. The more champions, decision-makers, and influencers viewing your resources, the stronger your buying consensus tends to be — and the better your odds of closing.
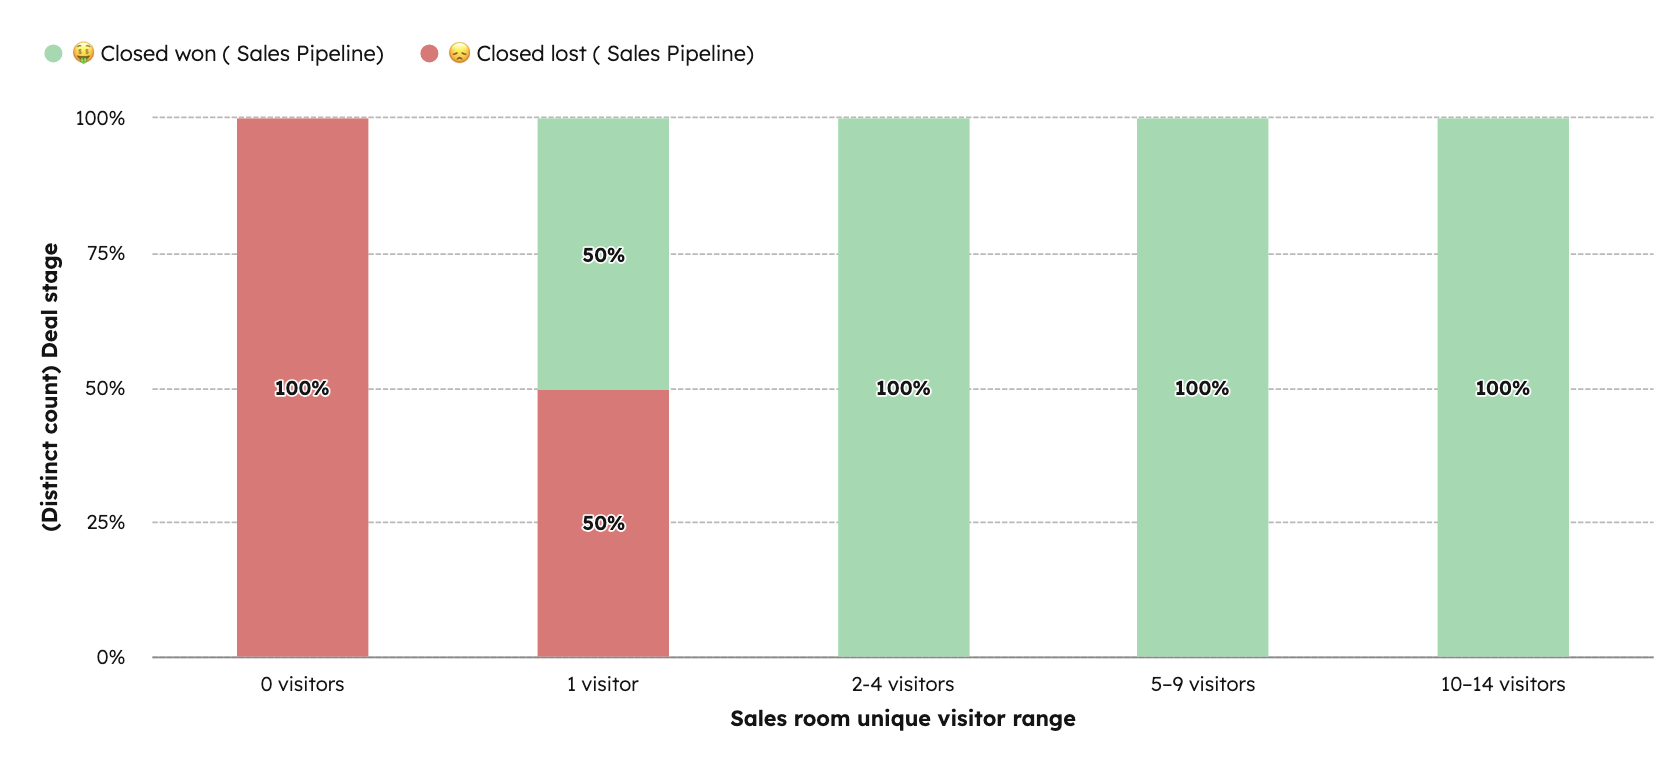
This report in HubSpot shows you close rates segmented by the number of unique visitors to each sales room. By bucketing deals into ranges of visitors, you’ll clearly see how deal outcomes change when more people inside the buyer’s org are involved.

Part 1: Create a custom property
First, create a property to capture the visitor ranges.
- Go to Settings > Properties
- Create a new property called Sales room unique visitor range
- Set it as a Dropdown select field
- Add the following options (or whatever makes sense for your sales process):
- 0 visitors
- 1 visitor
- 2-4 visitors
- 5-9 visitors
- 10-14 visitors
- 15+ plus visitors

Part 2: Set up a workflow to bucket the property values
Step 1: Create a deal-based workflow
- Go to Workflows > Create workflow > Deal-based workflow
- Set the enrollment trigger to when the property Arrows room number of unique visitors changes
Step 2: Add branches for visitor ranges
- Add branches that align with your dropdown buckets:
- 0 visitors
- 1 visitor
- 2-4 visitors
- 5-9 visitors
- 10-14 visitors
- 15+ plus visitors
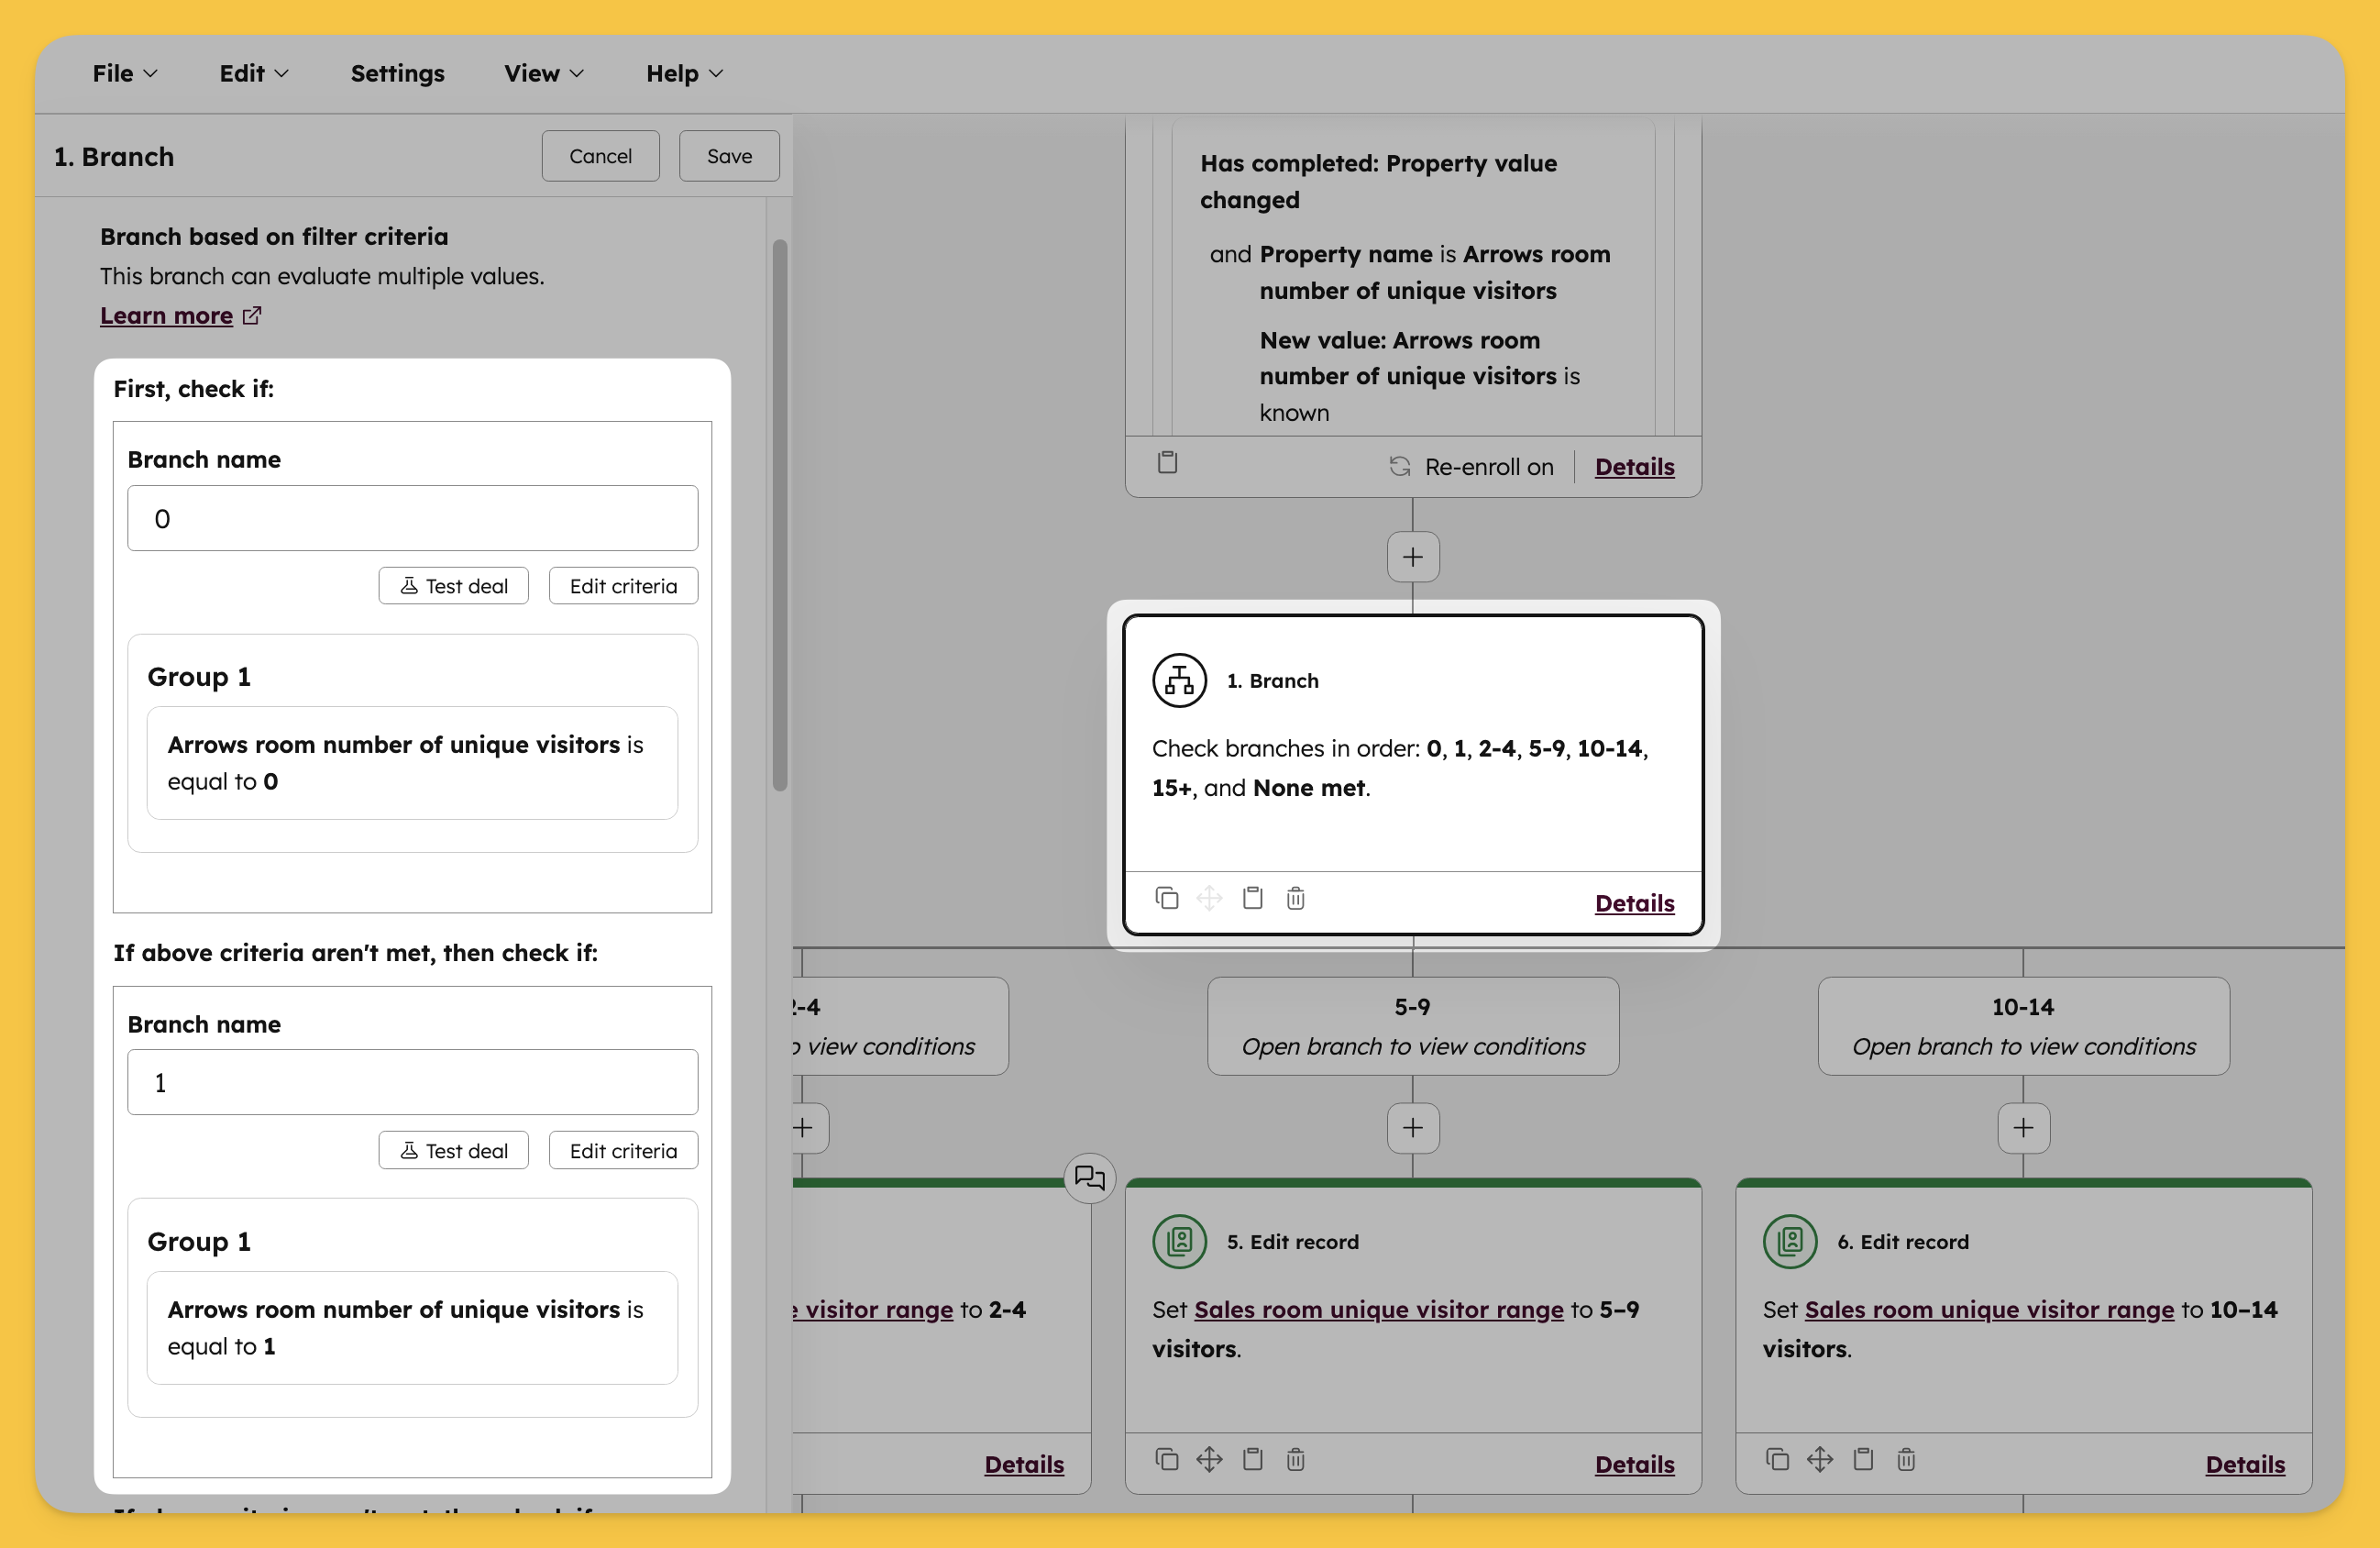
Step 3: Set property values for each branch
- For each branch, add an Edit record action
- Select the property Sales room unique visitor range
- Set the value to the matching dropdown option
- Example: In the 5-9 visitors branch, set the property value to “5-9 visitors”

This way, whenever the number of unique visitors changes, the deal is automatically bucketed into the right range.
Part 3: Set up the custom report
Step 1: Create a custom report
- Go to Reports > Create custom report
- Choose Deals as the object
Step 2: Add report filters
- Filter Deal stage to only include Closed won and Closed lost
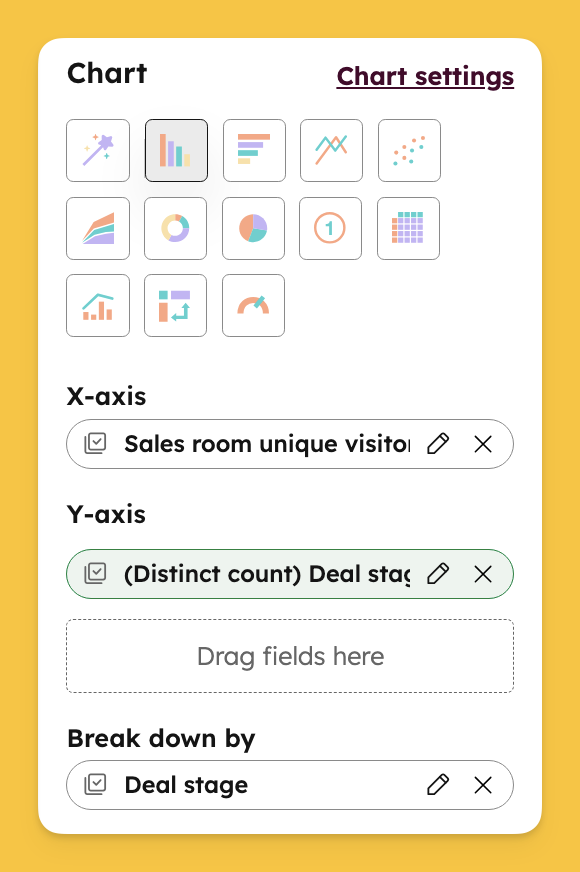
Step 3: Configure the chart
- Chart type: Vertical bar
- X-axis: Sales room unique visitor range (the property you created)
- Y-axis: Count of deals
- Break down by: Deal stage
Step 4: Customize colors (recommended
- In Chart settings, set Closed won = Green and Closed lost = Red
- This makes it clear how win/loss rates shift across visitor ranges

What this report tells you
This report shows how your win rates change as more stakeholders view the sales room. For example, you may see that deals with just one visitor close at a much lower rate, while those with five or more visitors are far more likely to close.
By tracking this over time, you can demonstrate the value of driving multi-threaded engagement in sales rooms — and coach reps to invite and enable more stakeholders earlier in the process.
💡 Want to see more sales room reports in HubSpot? Check out our full guide to the top 10 sales room reports with step-by-step instructions here!
Steal this cheat sheet for running customer success in HubSpot
Not sure where to start? Download the 7 playbooks you need to scale across the customer journey.