Track active deals by sales room activity level in HubSpot
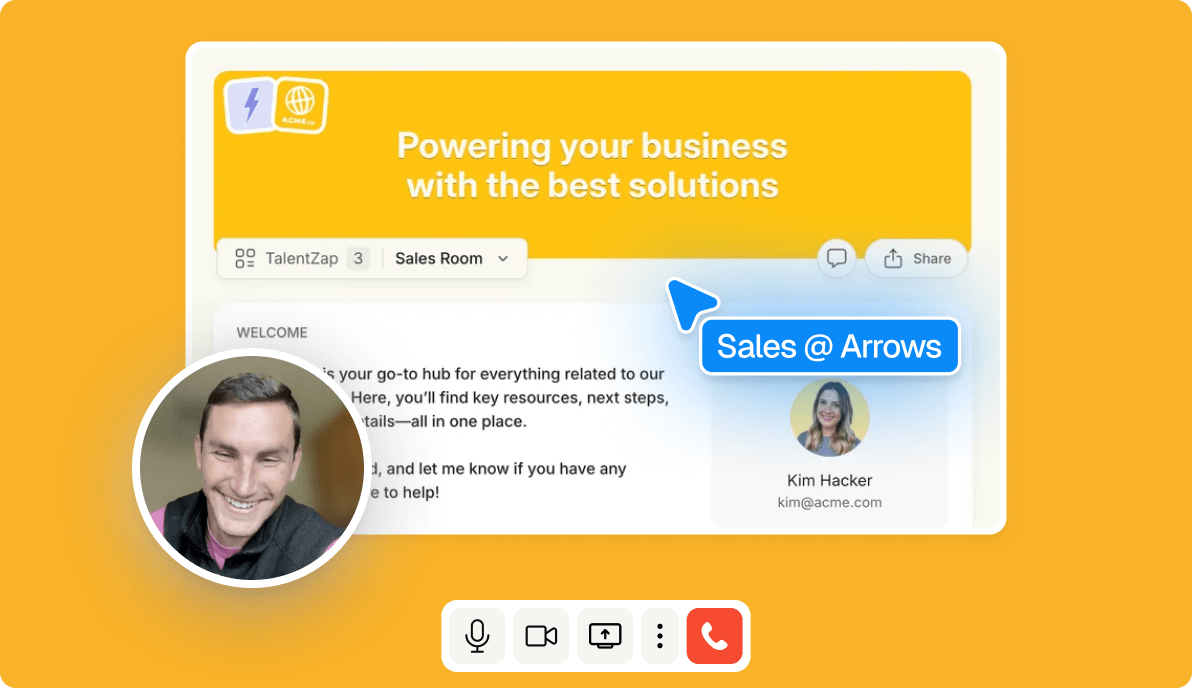
In your Arrows sales rooms, you define what sales room engagement means for your team. For example, you might set Hot as “opened more than 5 times in the last 7 days” and Engaged as “opened at least once in the last 7 days.” Arrows automatically tracks that activity, with other statuses like Stalled and Unopened updating as buyer behavior changes.
When you connect your Arrows sales rooms to HubSpot, those activity levels sync directly to your deal records. This means you can build a HubSpot report that shows every active deal broken down by engagement level, helping your team instantly see which buyers are heating up, which are going cold, and where to focus next.
Here’s how to set it up:
Step 1: Create a new custom report in HubSpot
Start by building a report on the deal object so you can connect directly to your Arrows sales room activity property.
- Go to Reports > Create custom report
- Choose Deals as your data source (or whichever HubSpot object your Arrows rooms are tied to)
Step 2: Apply filters
Narrow the report to only show active deals with connected sales rooms.
- Filter Deal stage to include active stages (e.g., Agreement Sent, Evaluation, Exploration)
- Filter Arrows room activity level to is known
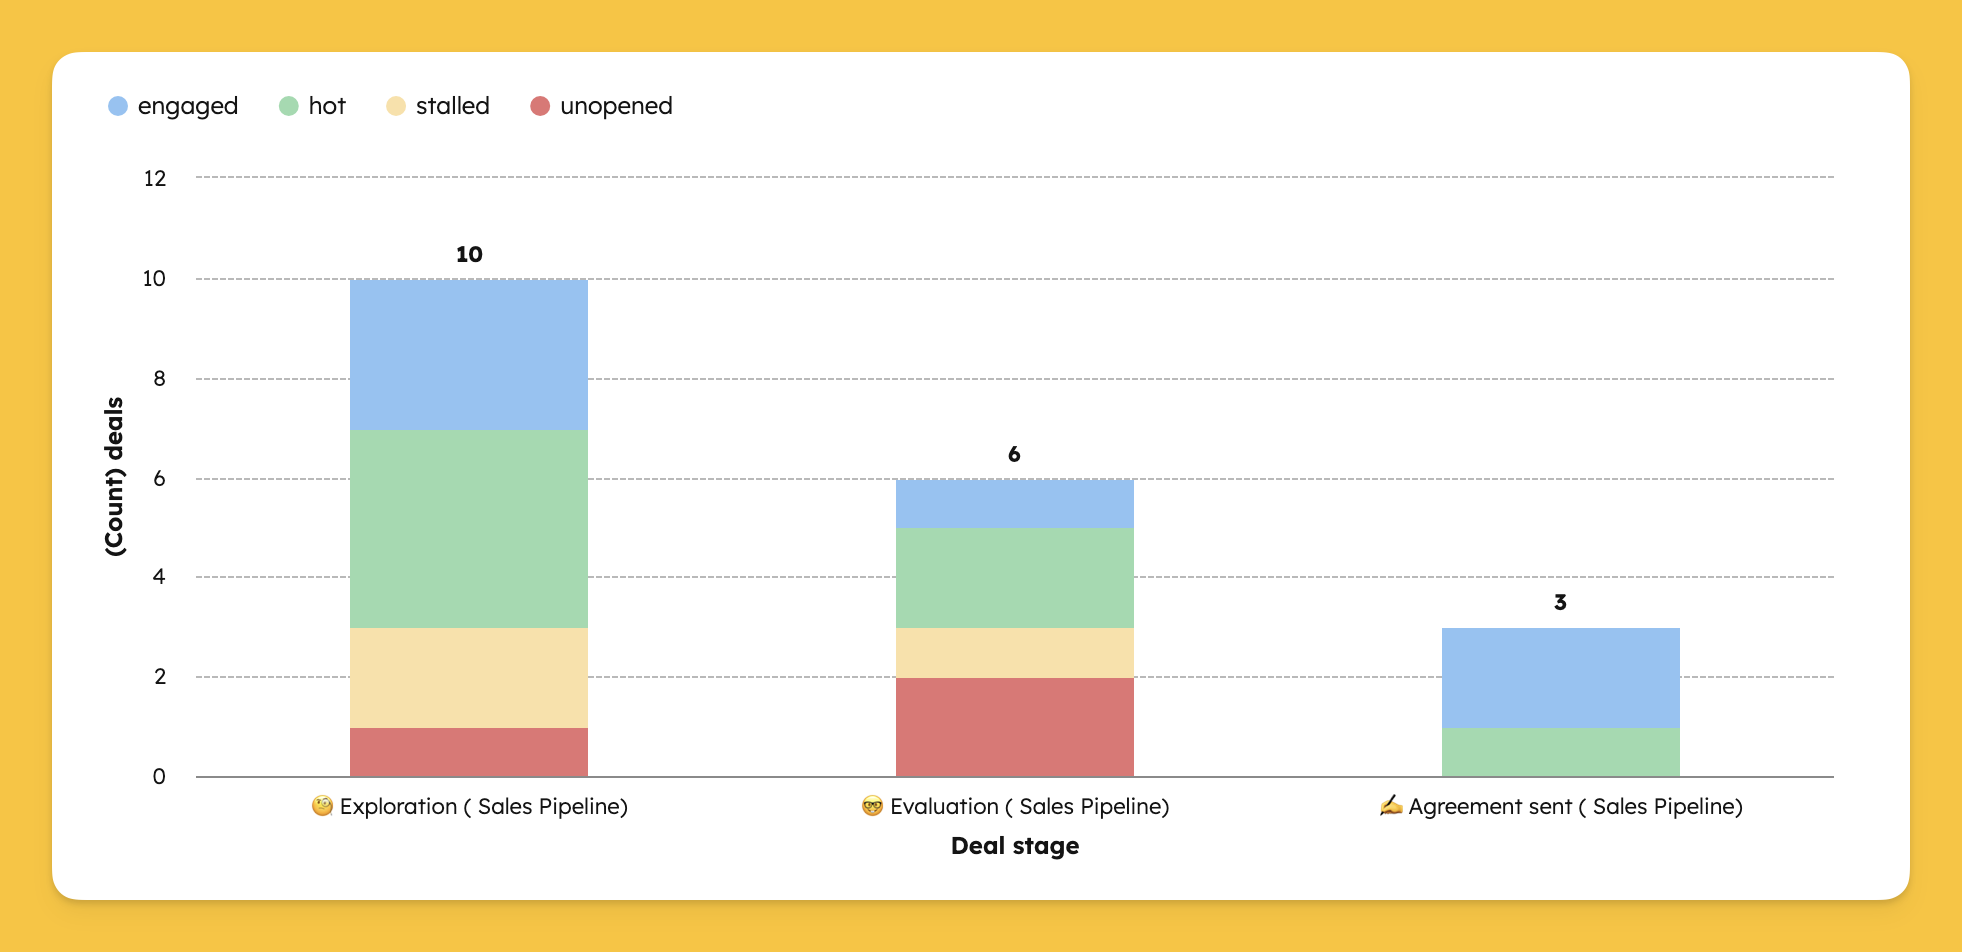
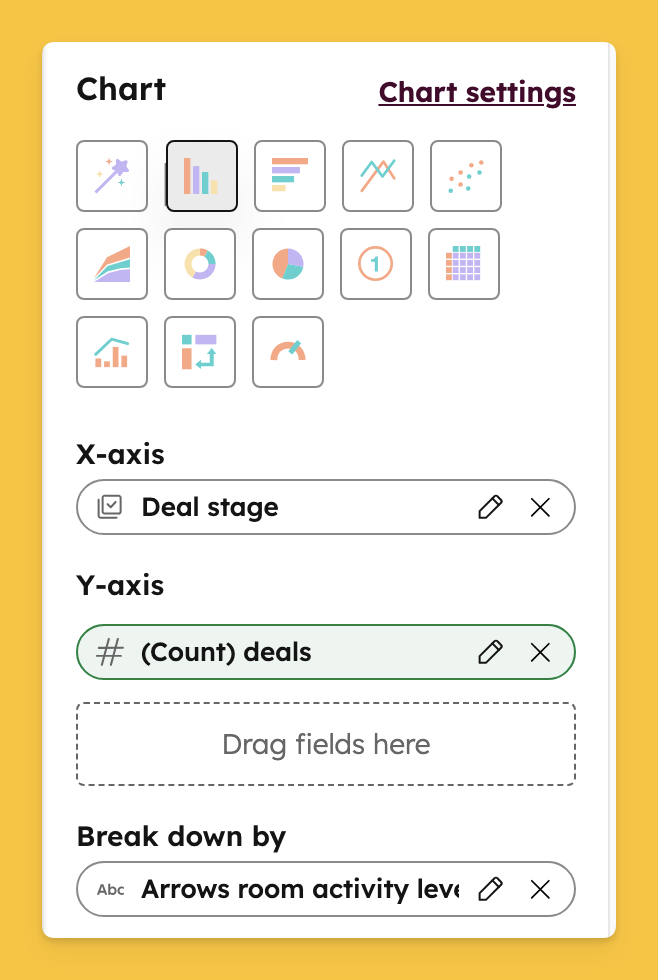
Step 3: Configure the bar chart
Now set up your visualization so you can easily compare engagement across your pipeline.
- Chart type: Vertical bar
- X-axis: Deal stage (or Deal owner if you’d like to view by rep)
- Y-axis: Count of deals
- Break down by: Arrows room activity level (Hot, Engaged, Stalled, Unopened)
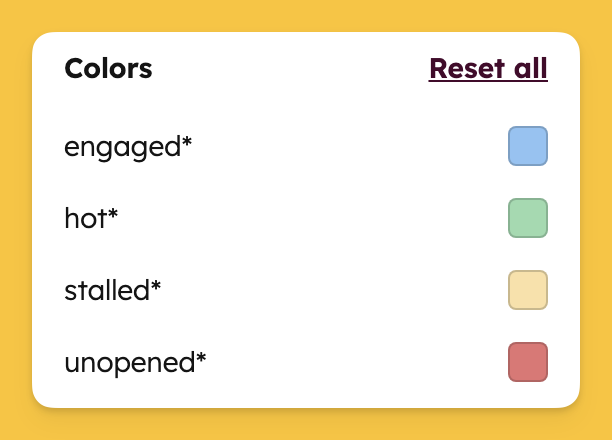
Step 4: Customize your report colors (optional)
Make the report easier to scan by assigning colors to activity levels.
To do this in HubSpot, click on Chart settings, scroll to the bottom, and set the colors for each property value.
- Red = Unopened
- Yellow = Stalled
- Blue = Engaged
- Green = Hot
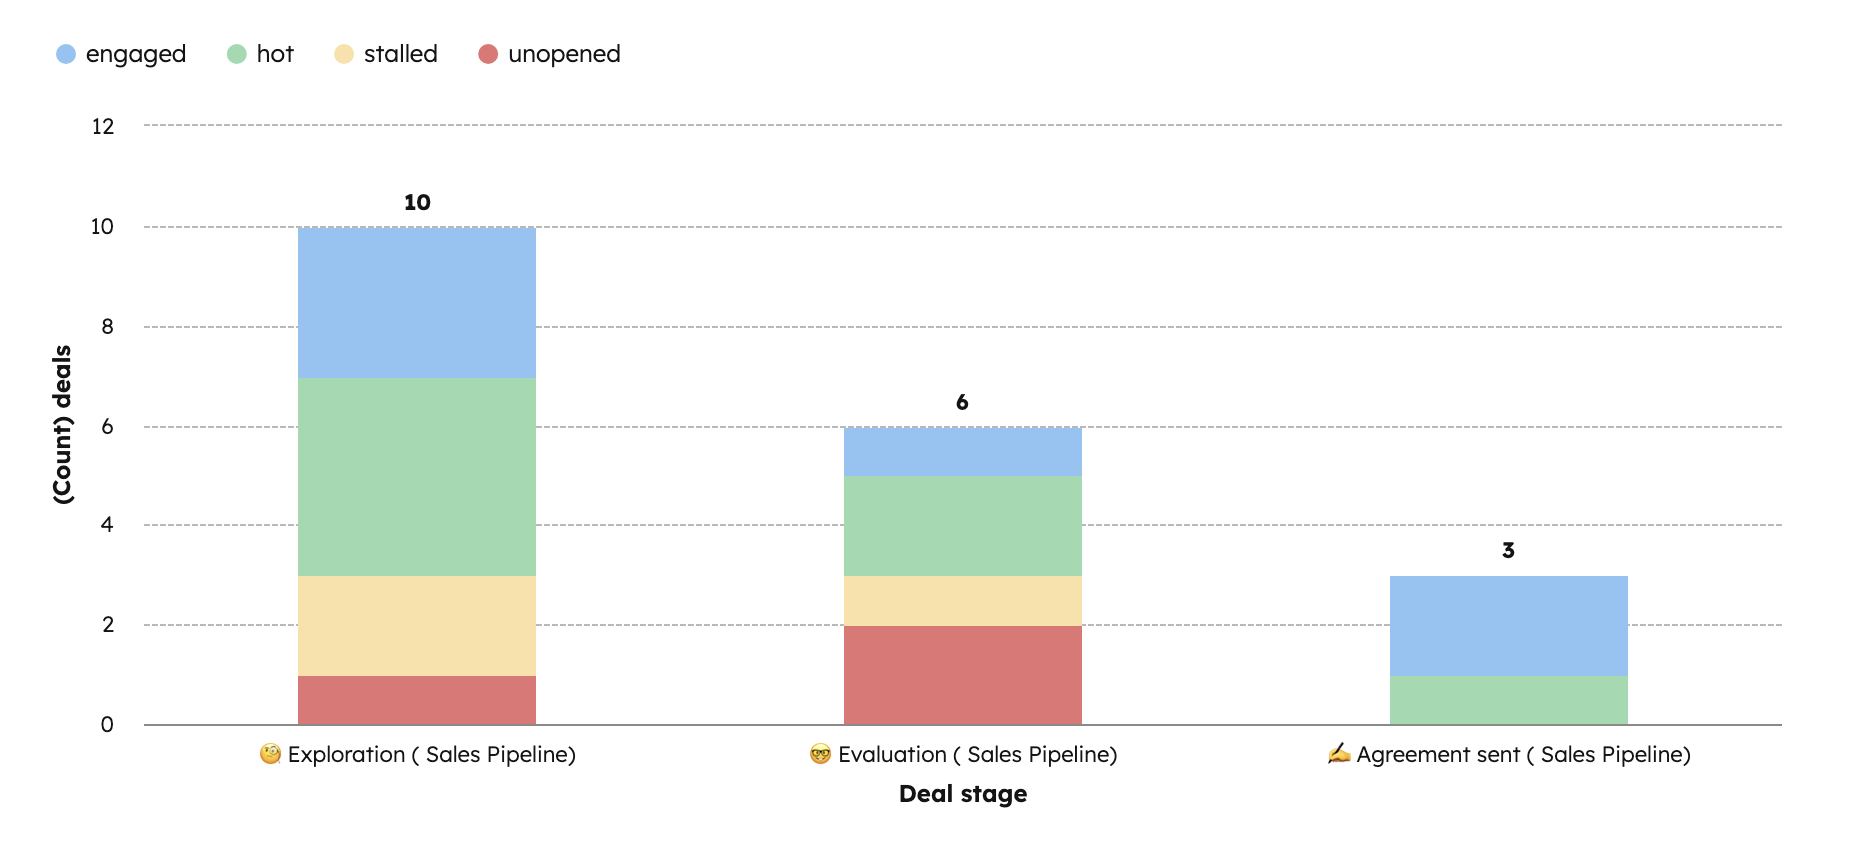
What this report tells you
Your finished report will display every active deal segmented by stage and broken down by sales room activity level. When a buyer’s engagement changes, the Arrows property on the deal updates automatically and your chart refreshes in real time. This helps your team focus on hot, active buyers and quickly spot stalled deals that need attention.
💡 Want to see more sales room reports in HubSpot? Check out our full guide to the top 10 sales room reports with step-by-step instructions here!
Steal this cheat sheet for running customer success in HubSpot
Not sure where to start? Download the 7 playbooks you need to scale across the customer journey.