
See which sales reps drive the most sales room views

Arrows sales rooms make it easy to see how engaged buyers are across deals. But sometimes the real insight is on your own team. This report shows which sales reps are driving the most total sales room views, giving managers a way to spot best practices.
If one rep consistently has higher engagement, it could be due to how they introduce sales rooms, the content they add, or the way they follow up. With this report, you can learn from top performers and coach the rest of the team on how to use sales rooms more effectively.
Step 1: Build a custom report
Start with a deal-based custom report so you can analyze Arrows activity by rep.
- Go to Reports > Create custom report
- Choose Deals as the object
Step 2: Apply filters
Limit the report to only include deals with a connected sales room.
- Filter Arrows room total views to is known
- (Optional) Filter by specific Deal owners if you only want to compare certain reps
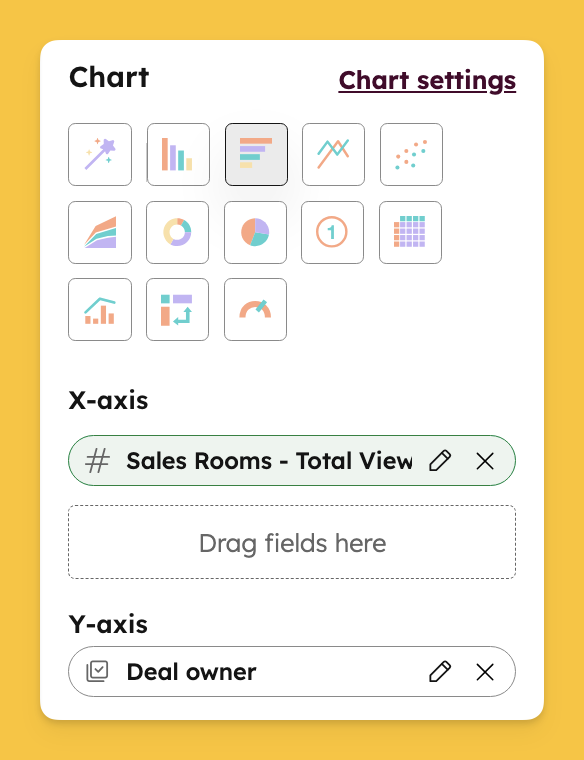
Step 3: Configure the bar chart
Use a horizontal bar chart to compare reps side by side.
- Chart type: Horizontal bar
- X-axis: Arrows room total views
- Y-axis: Deal owner
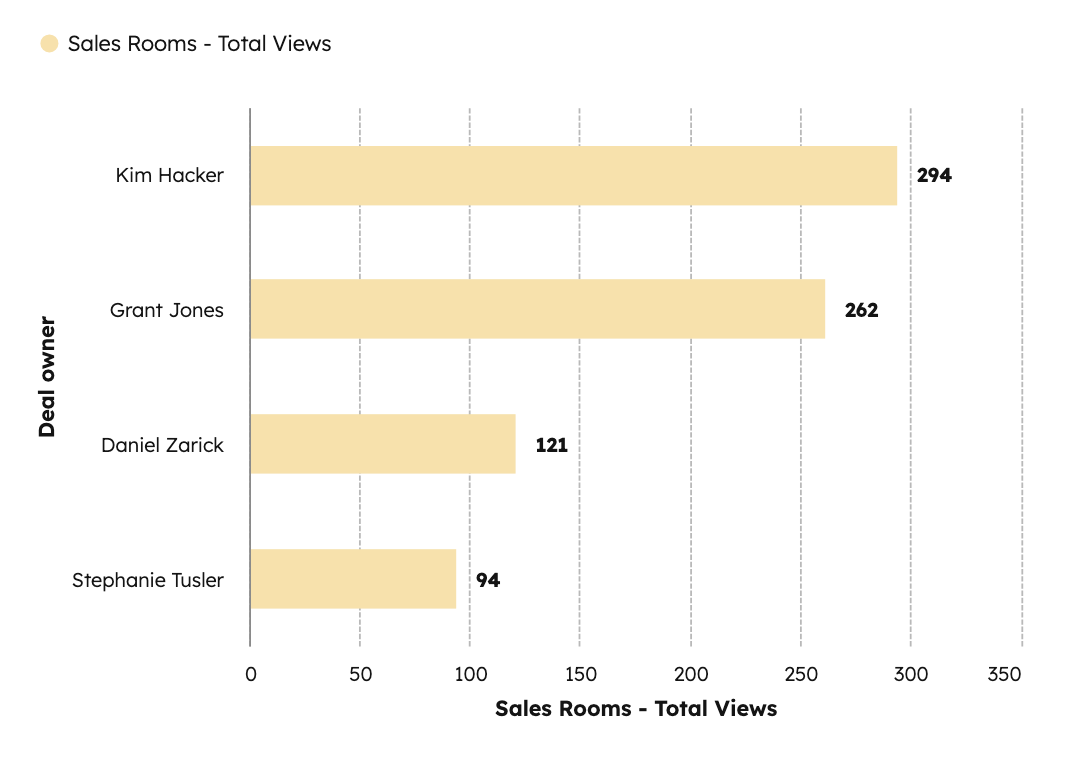
What this report tells you
This report shows how total sales room engagement is distributed across your sales team. If one rep consistently drives higher views, you can dig into their process — how they position sales rooms, what content they include, and how often they nudge buyers. Those insights can then be shared across the team to improve everyone’s use of sales rooms.
Call to action
💡 Want to see more sales room reports in HubSpot? Check out our full guide to the top 10 sales room reports with step-by-step instructions here!
Steal this cheat sheet for running customer success in HubSpot
Not sure where to start? Download the 7 playbooks you need to scale across the customer journey.