Compare deal performance with and without sales rooms in HubSpot
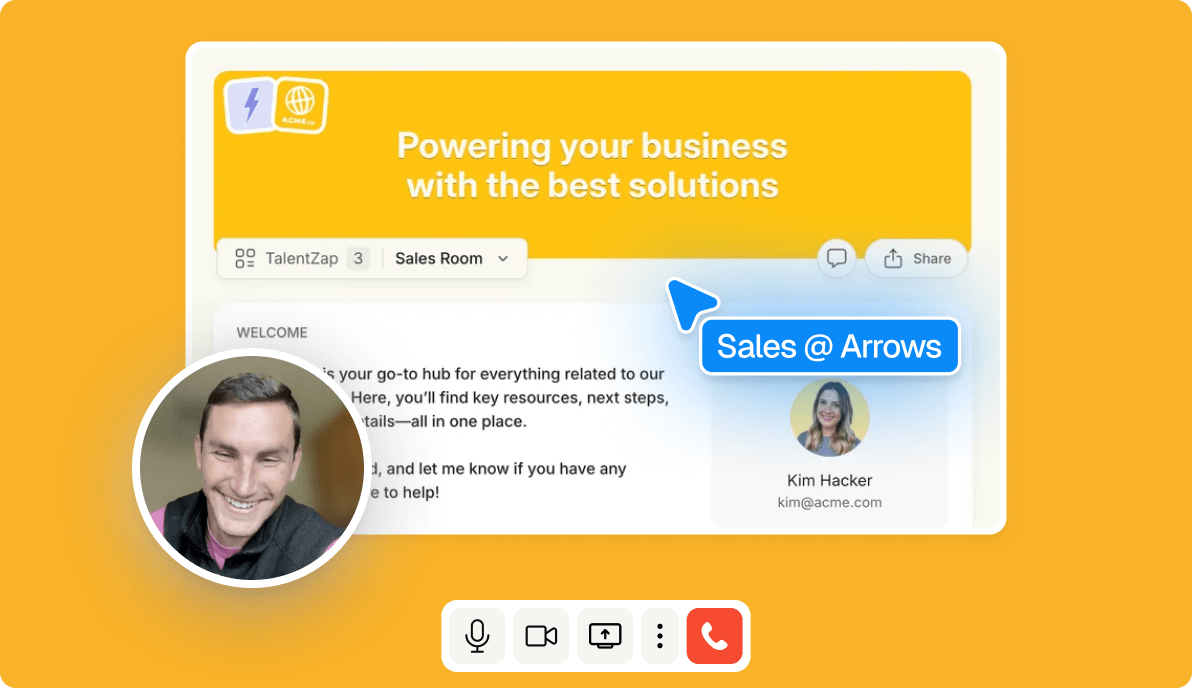
If you’re rolling out Arrows sales rooms gradually — maybe testing them with just a subset of buyers or specific reps — you’ll want to see how those deals perform compared to deals without sales rooms. Arrows automatically syncs data back to HubSpot, so you can isolate deals that had a room attached and measure outcomes like deal velocity and average contract value.
By creating two simple KPI reports side by side, you can compare metrics like days to close and average deal size for deals with sales rooms versus deals without. This gives you an early signal of how sales rooms may be influencing performance, even if other factors (like rep behavior or buyer type) also play a role.
Step 1: Create a single object report
Start with a deal-based report so you can filter on closed-won outcomes and Arrows sales room data.
- Go to Reports > Create report > Single object
- Select Deals as the object
Step 2: Apply report filters
Set your report to only include closed-won deals in the timeframe you want to analyze.
- Filter Close date to the desired range (e.g., Last quarter)
- Filter Deal stage to Closed won
- Filter Arrows room URL to is known (ensures the deal had a sales room attached)
Step 3: Configure the KPI visualization
Use a KPI chart to track the metrics that matter for closed deals.
- Visualization type: KPI
- Metrics to display:
- Average days to close (in company currency)
- Sum of amount (in company currency)
- Average amount (in company currency)
Step 4: Duplicate the report for deals without a sales room
To compare side by side, clone your report and update the filter to capture deals without an attached sales room.
- Change Arrows room URL to is unknown
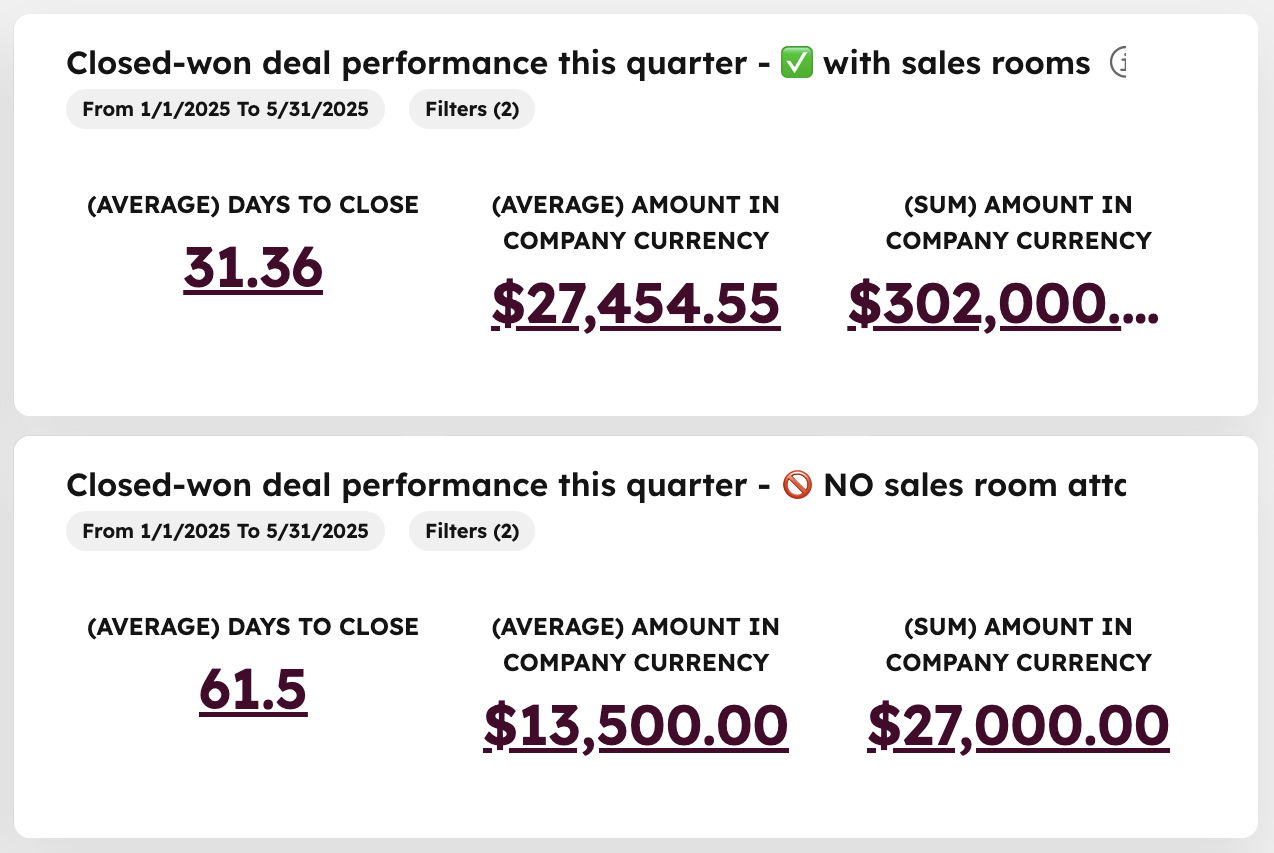
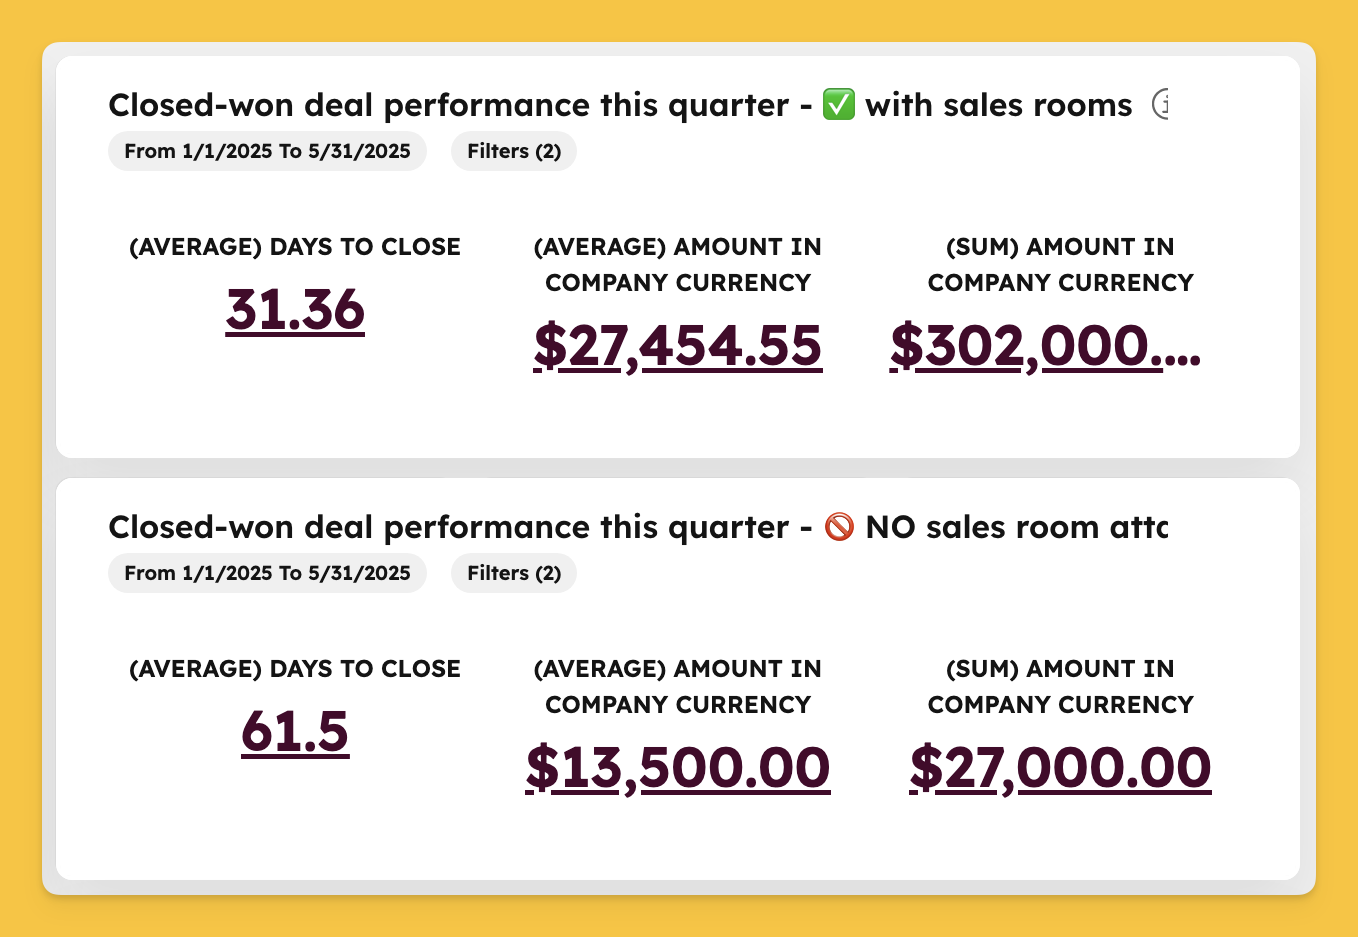
What this report tells you
You’ll now have two KPI reports: one showing closed-won performance with sales rooms, and one without. Placed side by side on a dashboard, this comparison helps you spot early trends in how sales rooms impact deal velocity and value. Keep in mind that other factors — like rep adoption or customer type — also influence performance, but this view gives you a clear baseline for measuring the impact of Arrows on your closed deals.
💡 Want to see more sales room reports in HubSpot? Check out our full guide to the top 10 sales room reports with step-by-step instructions here!
Steal this cheat sheet for running customer success in HubSpot
Not sure where to start? Download the 7 playbooks you need to scale across the customer journey.