Measure deal velocity with Arrows sales rooms in HubSpot
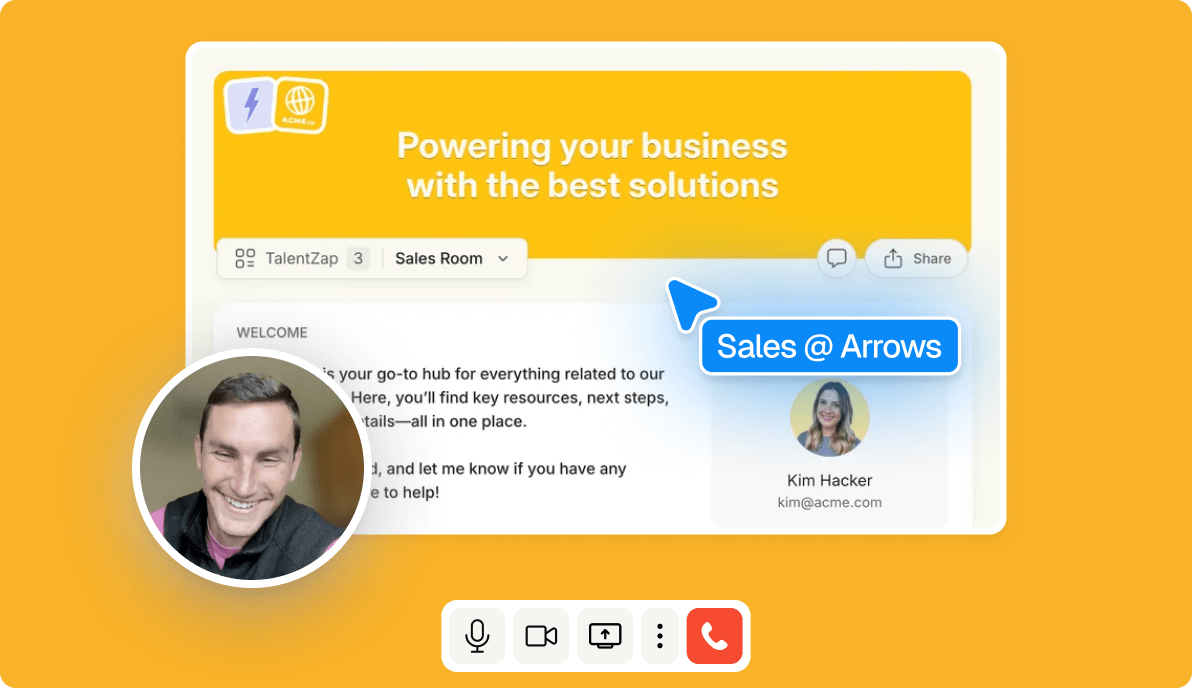
One of the biggest benefits teams see when using Arrows sales rooms is faster deal velocity. By giving champions a single place with all the content, clarity, and tools they need, you remove friction from the buying process and help buyers keep momentum.
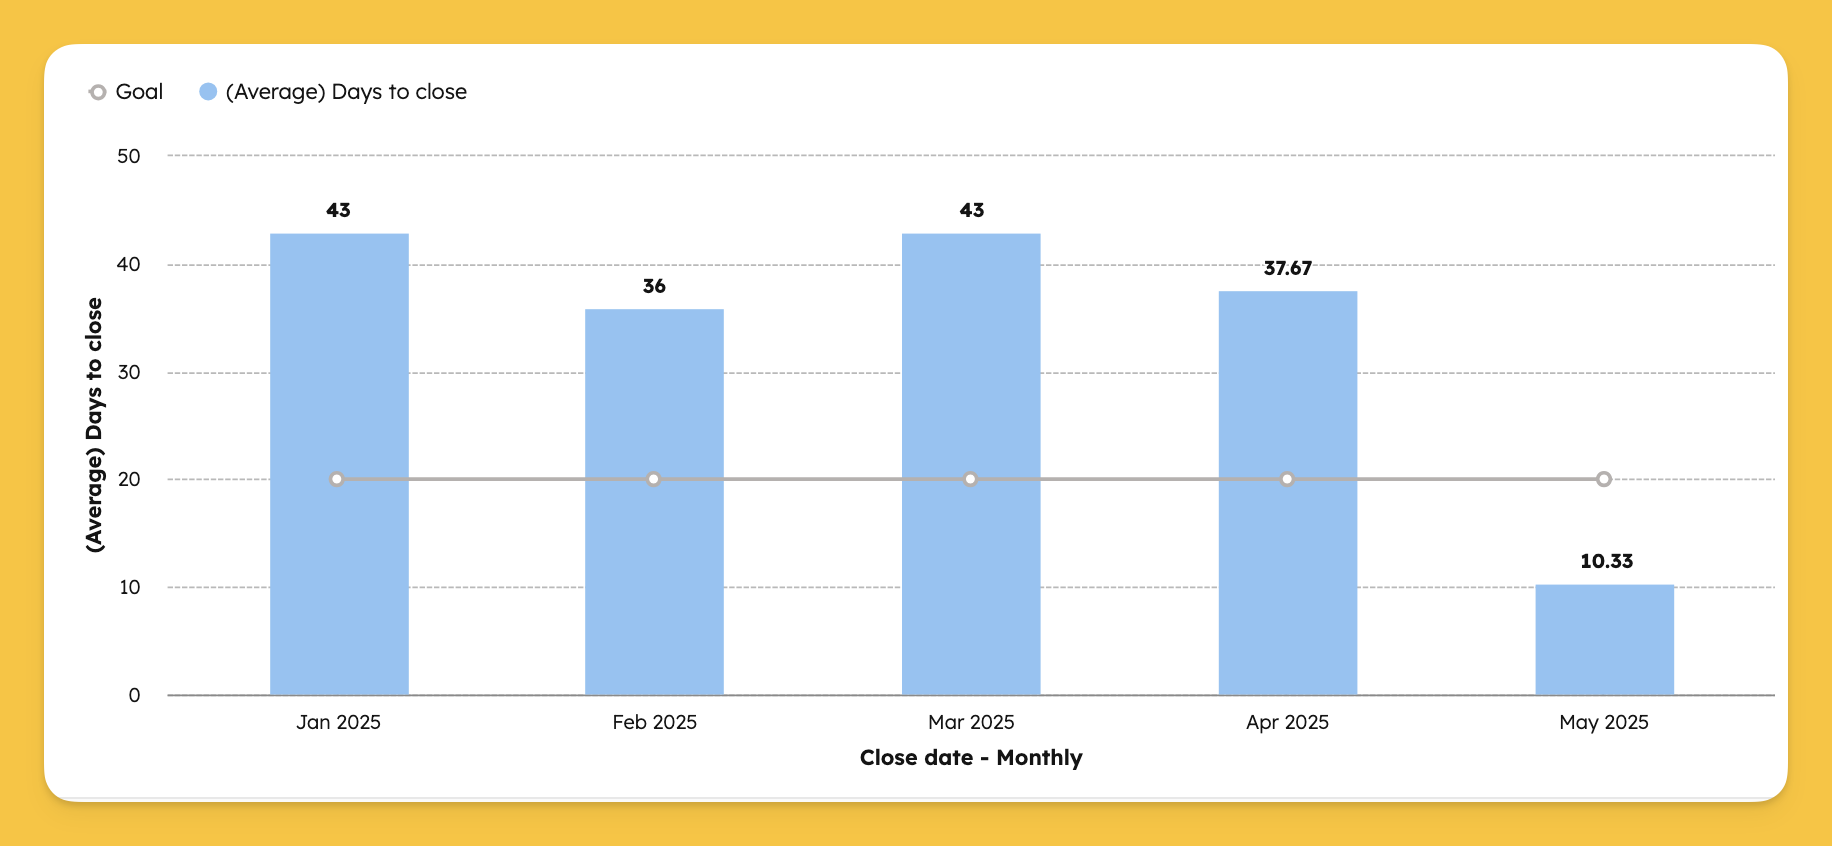
This report helps you track that impact directly in HubSpot. By visualizing the average days to close for all deals with sales rooms attached, month over month, you’ll see whether your changes to templates, content, or processes are improving deal velocity.
Step 1: Build a custom report in HubSpot
Start with a deal-based custom report to connect directly to your Arrows sales room data.
- Go to Reports > Create custom report
- Select Single object
- Choose Deals as the object
Step 2: Apply report filters
Narrow the report to only include closed-won deals with a sales room attached.
- Filter Arrows room URL to is known
- Filter Deal stage to Closed won
- Filter Close date to your desired range (e.g., from when you started using sales rooms until today)
Step 3: Configure the bar chart
Use a vertical bar chart to visualize average time to close across months.
- Chart type: Vertical bar
- X-axis: Close date (set frequency to Monthly)
- Y-axis: Days to close (use Average aggregation)

Step 4: Add a monthly goal (optional)
If you have a target for how quickly deals should close, set up a goal line for comparison.
- Open Chart settings
- Scroll to Goal line
- Enter your monthly average days to close goal
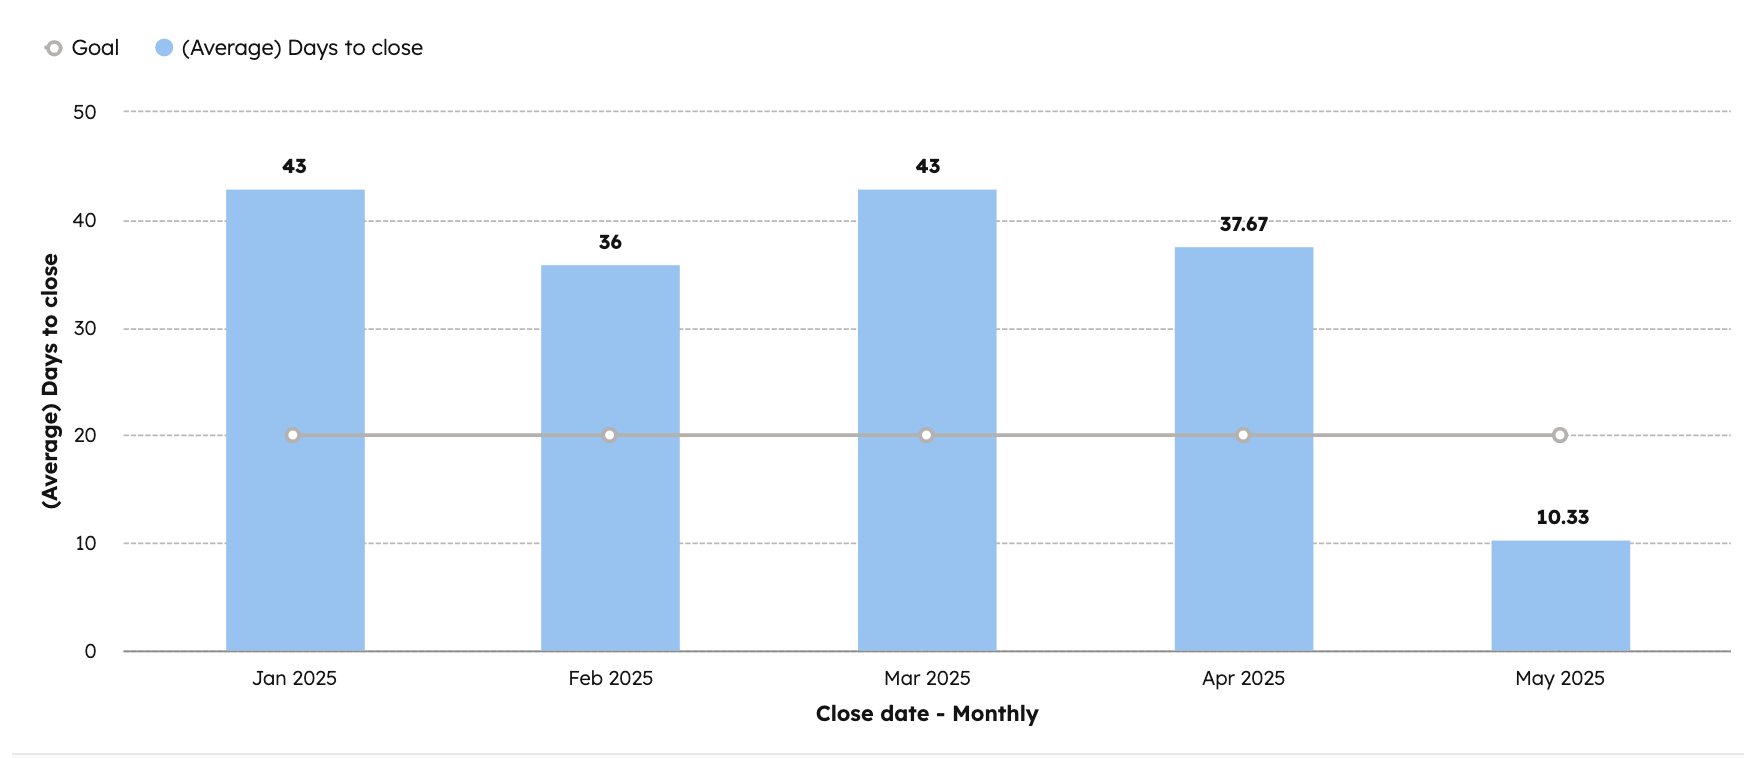
What this report tells you
This report shows whether deals with sales rooms are closing faster over time, broken out by month. If you see the average days to close trending downward, it’s a signal that your buyers are finding value in the content and structure of your sales rooms. Adding new resources or refining templates can be directly measured against this chart, helping you track improvements in deal velocity.
💡 Want to see more sales room reports in HubSpot? Check out our full guide to the top 10 sales room reports with step-by-step instructions here!
Steal this cheat sheet for running customer success in HubSpot
Not sure where to start? Download the 7 playbooks you need to scale across the customer journey.