
Track sales room views across active deals in HubSpot

Arrows automatically tracks how often buyers view their sales room, giving you a direct signal of deal engagement. By pulling this data into HubSpot, you can visualize every active deal ranked by total room views.
This makes it easy to see which deals are highly engaged, which may need a follow-up nudge, and which are stalling out with little to no activity. With a simple bar chart, you’ll know at a glance where buyer engagement is strongest in your pipeline.
Step 1: Build a custom report in HubSpot
Start with a deal-based custom report to bring in room view data.
- Go to Reports > Create custom report
- Select Single object
- Choose Deals as the object
Step 2: Apply report filters
Limit the report to only show deals that are both active and have an attached sales room.
- Filter Deal stage to include active stages (e.g., Agreement Sent, Evaluation, Exploration)
- Filter Arrows room total views to is known
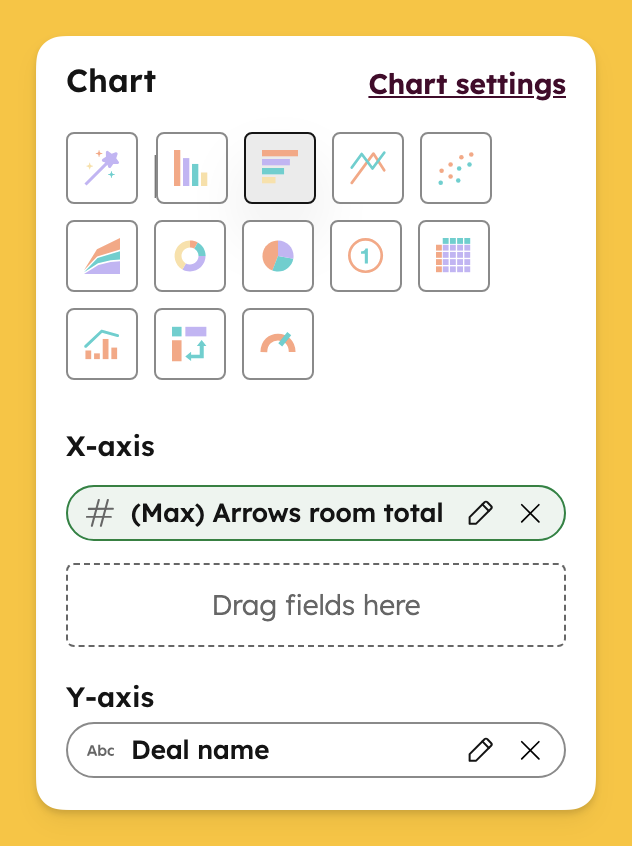
Step 3: Configure the bar chart
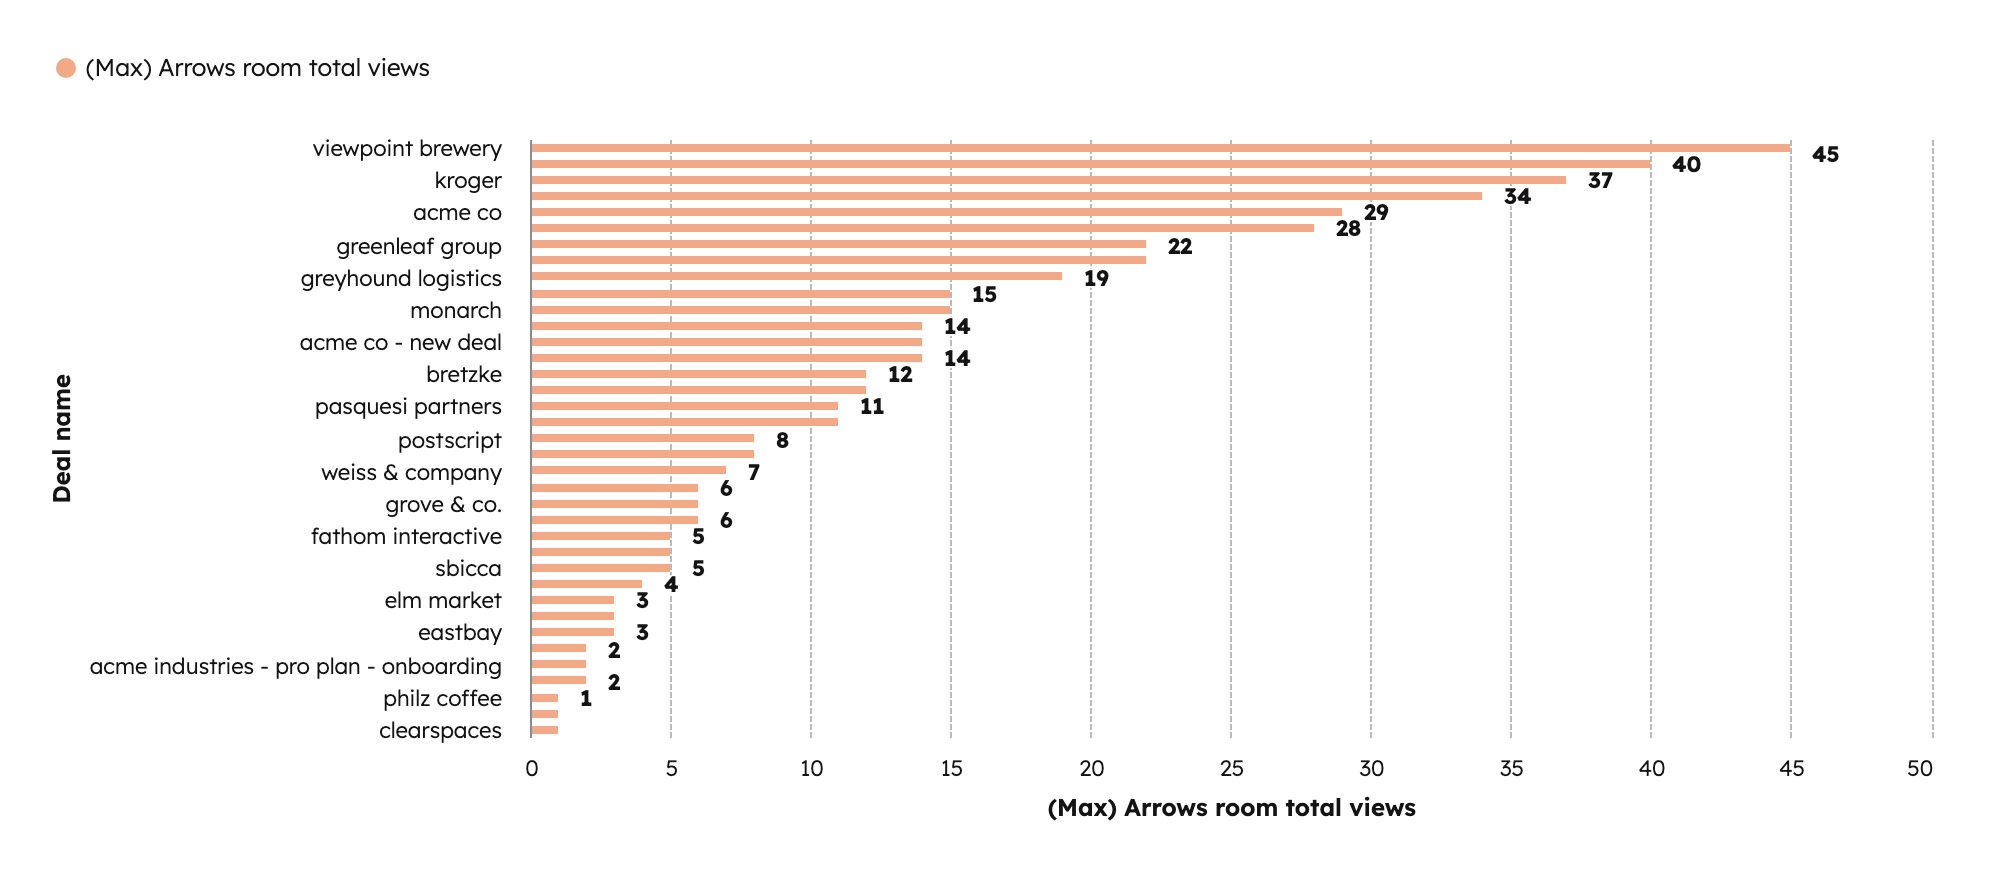
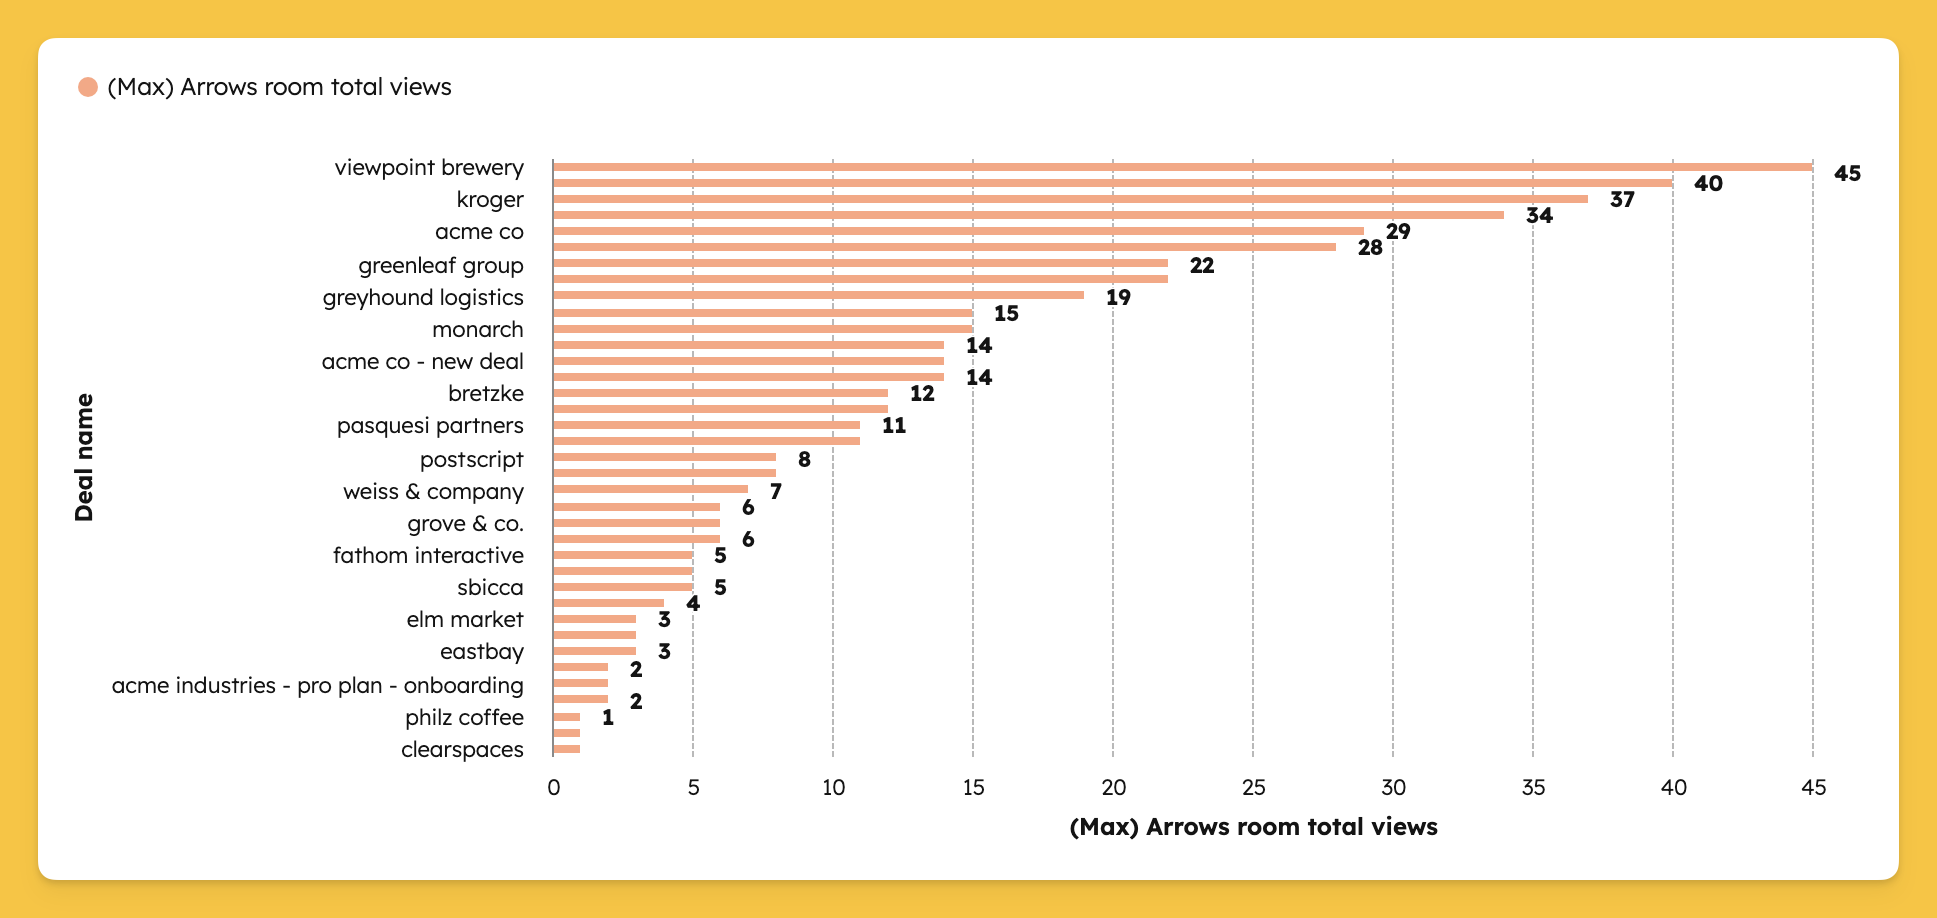
Use a horizontal bar chart to clearly compare room views by deal.
- Chart type: Horizontal bar
- X-axis: Arrows room total views
- Y-axis: Deal name
What this report tells you
Your report will show all active deals ranked by how many times their sales room has been viewed. High-view deals indicate strong buyer engagement, while low- or no-view deals may require a check-in or could signal that the opportunity is at risk. This helps your sales team prioritize attention and spot deals that might otherwise slip through the cracks.
💡 Want to see more sales room reports in HubSpot? Check out our full guide to the top 10 sales room reports with step-by-step instructions here!
Steal this cheat sheet for running customer success in HubSpot
Not sure where to start? Download the 7 playbooks you need to scale across the customer journey.