
Learn
Customers
Pricing
Login
Try Arrows
Blog
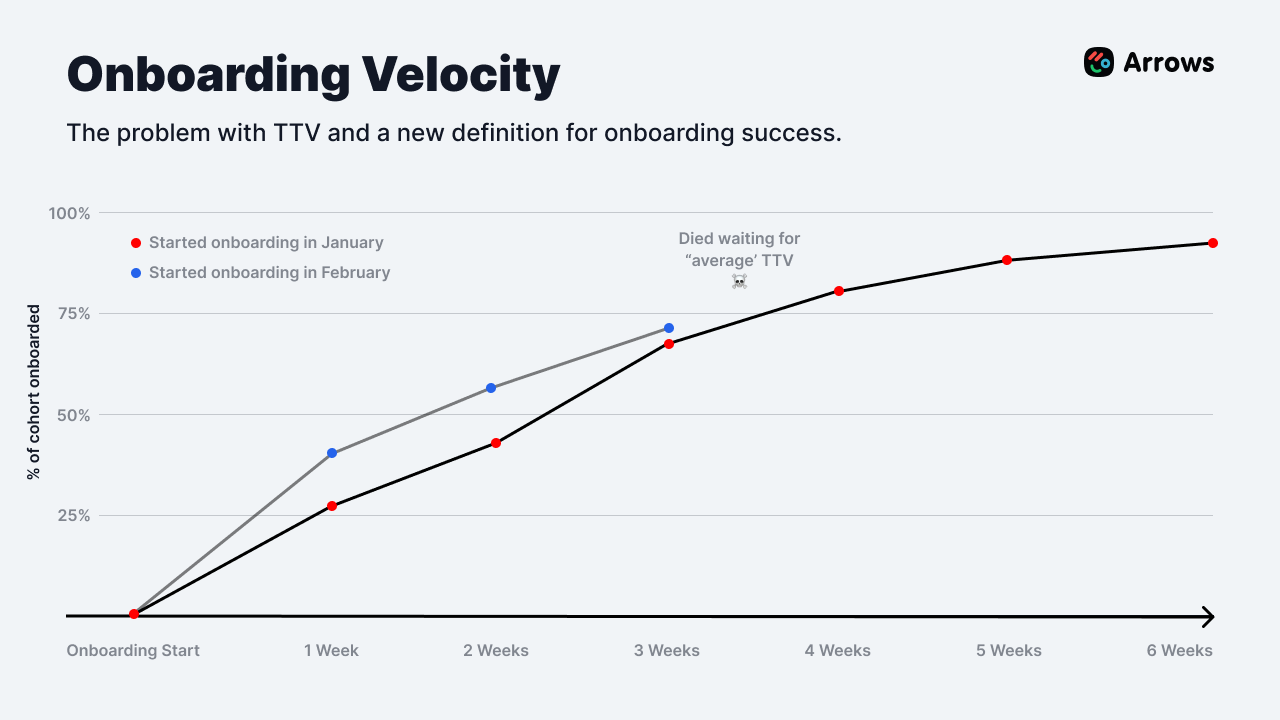
The problem with using any simple measure of time to value, onboarding completion percentage or time to adoption is your onboarding might fail before customers reach the average for any of those metrics.

Stuart Balcombe
February 25, 2022
•
6 minutes

Does your team run customer onboarding in HubSpot? You should check out what Arrows can do.
This is the second edition in a 3-part series on onboarding metrics and experiments. In part 1 we discussed why using average metrics like “time to value” can be deadly for understanding your onboarding performance.
ve·loc·i·ty
The speed of something in a given direction.
Onboarding provides accountability.
Accountability for the customer to the work required to achieve the outcomes they want.
Accountability for the company to avoid the lost revenue of a failed onboarding and set customers up for successful future expansion.
That’s the insight former Senior Lead of Retail Onboarding and Solution Engineering at Shopify Adam Jarczyn lays out in his data-driven approach to scaled onboarding that keeps accountability at it’s core.
“I was just a very curious person. I wanted to know why they’re getting stuck. That’s all I cared about. Like, why are they getting stuck? What are we doing to unstick them? Qualitatively, quantitatively, whatever it was, we’re going to unstick them.”
So with this in mind, how can we identify the roadblocks and understand how to “unstick” the customers stuck in our onboarding pipeline?
Introducing onboarding velocity.
Customers who maintain momentum and reach an activated and self-sustaining state are the gold-standard of onboarding success.
Let’s go back to our definition of velocity from the start.Velocity is a measure of speed in a given direction.In the case of onboarding, we want to know the speed of a customer towards the outcome they signed up for our product to achieve.
Measuring the velocity of the onboarding journey as a whole and the discrete actions along the way by customer cohort provides a model for both identifying current blockers AND predicting future performance.
At Shopify, Adam used activation velocity (as he referred to this curve) to identify that customers who had been in “onboarding” for more than 28 days were highly unlikely to launch and knowing that was able to reprioritize his team’s effort.“We had discovered that the first six weeks of the onboarding experiences were where merchants had the most momentum, and that if you couldn’t get them moving in six weeks, they were long‑tail lost. We said ok we’re going to keep ourselves committed that every merchant is going to get touched by onboarding every five days. So you know 8-9 touches over 42 days. After that the probability that they launch is low and we’ve lost too much momentum. That’s okay.”
The exact tasks and phases of your onboarding journey will be specific to your business.But it’s about the principle of knowing what the velocity of customers through your pipeline is at any point in time and using that knowledge to prioritize where you invest your effort to unblock them.Imagine if you could build these insights into your iterative onboarding process.Each cohort you onboard systematically layers learning and performance improvements into your onboarding playbook — driving improved predictability of both customer and business outcomes.
To calculate our onboarding velocity by cohort we need to identify the time between 2 points and a common attribute to bind customers who belong to the same cohort.
Let’s break down the data we need to graph our onboarding velocity:
Start date - When does onboarding begin?
End date - When is onboarding complete?
For example if we sell project management software we might use a start date of a customer moving to “Closed Won” in our sales pipeline and an end date of them having created their first 5 tasks in our product.
Using a spreadsheet you can then model the percentage of users who have completed onboarding (because they have an end date logged) over time.
From here we can add more granularity by including data about specific events that occur during the onboarding journey. This could be product actions taken or onboarding tasks completed.
To identify the areas of the onboarding journey to prioritize our investments we can look at the steepest part of the onboarding velocity curve for the entire experience.To identify specific sticking points in our onboarding journey we can look for the flattening of the curve in individual events within the onboarding journey.
There’s a single make or break data point to get granular insights into onboarding performance – A timestamp associated with each task completed or action taken in the pipeline.The problem is the way you set up your onboarding process doesn’t always provide this data point. At Arrows we typically see onboarding setup and tracked in one of three ways.
We’ve found using Deal Stages to track onboarding progress is simple to implement in any CRM and ensures you are capturing high-fidelity data about the movements in your pipeline.If accessing this level of onboarding data is a challenge for you, start by calculating the onboarding velocity for every onboarding together. We guarantee that if you focus on improving this number — even if it’s not 100% accurate — you will start to identify patterns and have a better view into where people are getting stuck.
A special thank you to Adam Jarczyn for sharing his insight from building the activation velocity metric at Shopify. His experience provides a fascinating view into what the future of onboarding can look like when lessons from sales and product are applied to drive customer outcomes. Learn more and connect with Adam on LinkedIn.
This kind of complex cohort analysis can require a lot of hacky workarounds and data wrangling.
We get that. That’s why we will soon be releasing onboarding velocity reporting directly inside Arrows to give you granular insights to improve your onboarding performance in 3 simple steps.
Want to make sure your pipeline is setup to enable this reporting? Just reply to this email and we’ll be happy to take a look.
—
The impact of improved insight and transparency goes beyond your onboarding pipeline too.
You’ll build better relationships with sales, marketing, and executive leadership as you can more easily point to the impact of upstream changes on adoption and lost revenue.
If you’re going to invest in onboarding this year, start with understanding your onboarding velocity.
Next week, we’ll be back with actionable tactics and strategies to handle common onboarding objections and unstick customers stuck in your pipeline.
Here’s where we are in our measurement and experimentation mini-series:
Join 6,000+ subscribers who read the Happy Customers newsletter—it's jam-packed with tips-and-tricks about onboarding, HubSpot, and making happy customers at scale.
Learn how other companies have scaled with Arrows, so their teams can help customers be successful at every stage of their journey.
Read customer stories


Walkthrough
Watch a quick tour of Arrows to see how it can streamline your onboarding process and connect to HubSpot.


Average review on G2, an independent review site

App installs
On the HubSpot App Marketplace

