
Learn
Customers
Pricing
Login
Try Arrows
Steal this HubSpot report to track the breakdown of revenue in your HubSpot deals 📊
You'll also be subscribed to the Happy Customers newsletter.
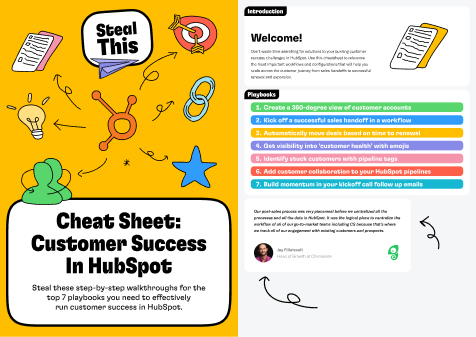
Not sure where to start? Download the 7 playbooks you need to scale across the customer journey.
You'll also be subscribed to our newsletter, which includes new posts added to The Vault.
Out of the box HubSpot’s sales tools are really only focused on helping you close new customers.
If you’re trying to use HubSpot as your source of truth for selling across the customer lifecycle, you'll want to start reporting on your renewal and expansion revenue.
With 70-80% of revenue per customer typically coming after the initial sale it’s a good idea to start by:
1. Defining the pipeline you will use to manage expansions (either your existing new business pipeline, renewal pipeline, or a dedicated expansion pipeline)
2. Extend the default HubSpot “Deal Type” property to allow more specific definitions of your closed revenue and add pipeline tags to visually identify revenue types in your pipeline.
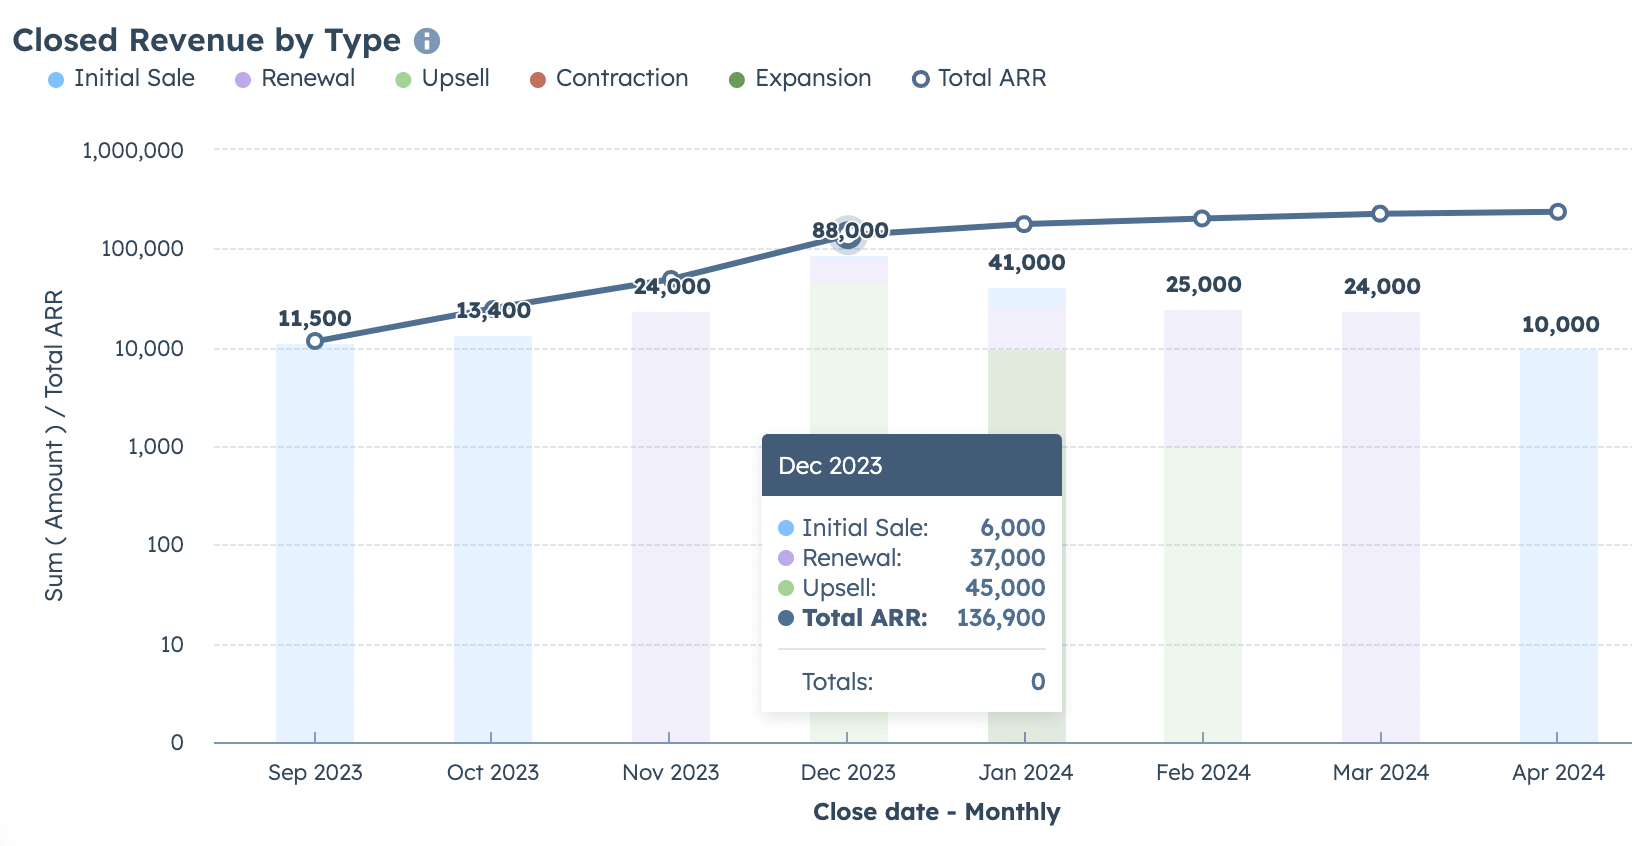
With this basic setup in place we can create an accurate report breaking down our closed revenue 💰
Here’s how it works:
Filter to the pipeline(s) where customer revenue is being tracked AND only deals that are “Closed Won” across those pipelines.

We’ll use the “Combination” chart type to show bars representing our monthly revenue by type and a line for our total cumulative ARR.

X-axis: Close Date - Monthly
Y-axis 1: Sum (Amount)
Y-axis 2: Sum (Amount) - Rename this to “Total ARR”
Break down by: "Deal Type"

Show this as “Bars” and set the Y-axis scale to “Logarithmic” to avoid the graph looking funky with a lot of whitespace as your total revenue becomes significantly higher than each single month over time.

Set this to show a “Line” and importantly check the box to make this field “Cumulative” so we are displaying total ARR instead of only the revenue for a single month.

Getting visibility into how your revenue is distributed each month can help your team focus on what’s most impactful to move the business forward.
Bonus: Don’t forget you can automatically send an email with your report to your team on a schedule (I prefer late Sunday night) so there’s no excuse for anyone not to have seen the numbers before your pipeline reviews.

Not sure where to start? Download the 7 playbooks you need to scale across the customer journey.
Walkthrough
Watch a quick tour of Arrows to see how it can streamline your onboarding process and connect to HubSpot.


Average review on G2, an independent review site

App installs
On the HubSpot App Marketplace

